I’ve been working with my colleague John Dias on a demo that involves deploying VMs via Cloud Automation Services and automatically configuring monitoring them with vRealize Operations. We needed a way to create Application and Application Tier objects during the provisioning process. Looking through the REST API documentation, there are no API calls specifically for creating Applications. I knew that behind the scenes, an Application and the Application Tiers are just objects with specific object types and relationships. I then thought that there are APIs to create objects and set relationships, so maybe I can string together those API calls to create an Application. It turned out to be simple to accomplish with only public APIs. Since I believe this could be useful for others in similar situations, I’d like to share the process.
Before I get started, I’d like to mention that all of the requests shown here are included in John Dias’ Postman collection. If you need help setting up Postman to use the collection, please check out this video. I will only cover the new request added to the collection.
Get Container Adapter Instance ID
The first step is to find the ID for the container adapter instance, which will be used by a couple of the subsequent calls.
Request
GET https://{{vrops}}/suite-api/api/adapters?adapterKindKey=Container
Response
{
 "adapterInstancesInfoDto": [
 {
 "resourceKey": {
 "name": "Container",
 "adapterKindKey": "Container",
 "resourceKindKey": "ContainerAdapterInstance",
 "resourceIdentifiers": [
 {
 "identifierType": {
 "name": "ClusterId",
 "dataType": "STRING",
 "isPartOfUniqueness": true
 },
 "value": "node1"
 }
 ]
 },
 "collectorId": 1,
 "collectorGroupId": "1f02507e-8a68-46bd-b765-af5229e65adb",
 "monitoringInterval": 1,
 "numberOfMetricsCollected": 0,
 "numberOfResourcesCollected": 0,
 "lastHeartbeat": 1560807657777,
 "lastCollected": 1560807637811,
 "messageFromAdapterInstance": "",
 "links": [
 {
 "href": "/suite-api/api/adapters/b76db3e0-5b7c-4755-ad35-d9c40c3f1628",
 "rel": "SELF",
 "name": "linkToSelf"
 },
 {
 "href": "/suite-api/api/credentials/",
 "rel": "RELATED",
 "name": "linkToCredential"
 }
 ],
 "id": "b76db3e0-5b7c-4755-ad35-d9c40c3f1628"
 }
 ]
}
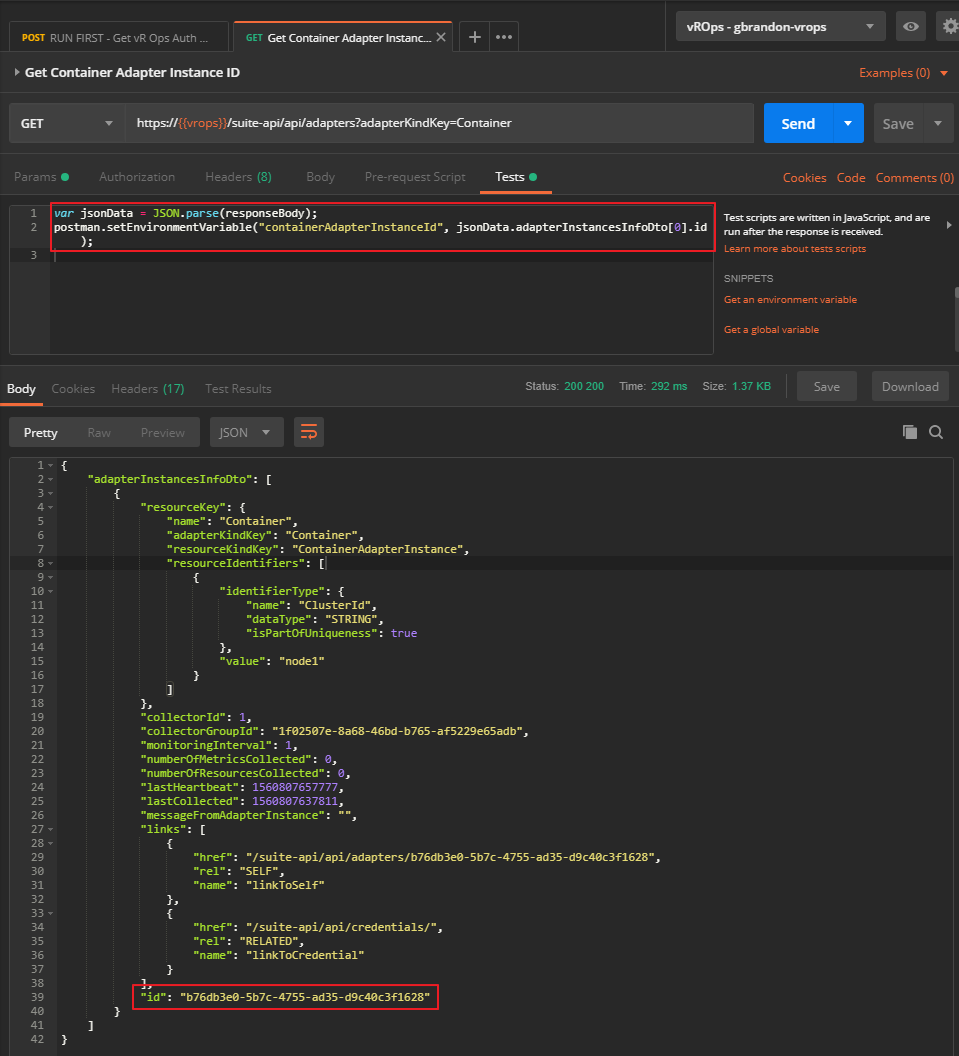
Parsed Response Body
While the response is an array of objects, there should only be one object return. We need to store the id, which I’ll call containerAdapterInstanceId. In this example containerAdapterInstanceId = b76db3e0-5b7c-4755-ad35-d9c40c3f1628.
![]()
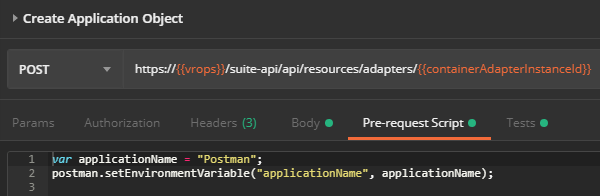
Create Application Object
The next step is to create the application object. In this example, I use a pre-request script in Postman to store the application name, “Postman” in the variable named applicationName on the Pre-request Script tab.
![]()
Request
POST https://{{vrops}}/suite-api/api/resources/adapters/{{containerAdapterInstanceId}}
Request Body
In the request body below, “{{applicationName}}” represents the name of the application being created, which is automatically replaced by the value entered in the Pre-request Script tab.
{
 "creationTime": null,
 "resourceKey": {
 "name": "{{applicationName}}",
 "adapterKindKey": "Container",
 "resourceKindKey": "BusinessService",
 "resourceIdentifiers": []
 },
 "resourceStatusStates": [],
 "resourceHealth": null,
 "resourceHealthValue": null,
 "dtEnabled": true,
 "monitoringInterval": 5,
 "badges": [],
 "relatedResources": [],
 "identifier": null
}
Response
{
 "resourceKey": {
 "name": "Postman",
 "adapterKindKey": "Container",
 "resourceKindKey": "BusinessService",
 "resourceIdentifiers": []
 },
 "resourceStatusStates": [],
 "dtEnabled": true,
 "monitoringInterval": 5,
 "badges": [],
 "relatedResources": [],
 "links": [
 {
 "href": "/suite-api/api/resources/7b891296-9ade-47fa-9d23-d56071fb8b3d",
 "rel": "SELF",
 "name": "linkToSelf"
 },
 {
 "href": "/suite-api/api/resources/7b891296-9ade-47fa-9d23-d56071fb8b3d/relationships",
 "rel": "RELATED",
 "name": "relationsOfResource"
 },
 {
 "href": "/suite-api/api/resources/7b891296-9ade-47fa-9d23-d56071fb8b3d/properties",
 "rel": "RELATED",
 "name": "propertiesOfResource"
 },
 {
 "href": "/suite-api/api/alerts?resourceId=7b891296-9ade-47fa-9d23-d56071fb8b3d",
 "rel": "RELATED",
 "name": "alertsOfResource"
 },
 {
 "href": "/suite-api/api/symptoms?resourceId=7b891296-9ade-47fa-9d23-d56071fb8b3d",
 "rel": "RELATED",
 "name": "symptomsOfResource"
 },
 {
 "href": "/suite-api/api/resources/7b891296-9ade-47fa-9d23-d56071fb8b3d/statkeys",
 "rel": "RELATED",
 "name": "statKeysOfResource"
 },
 {
 "href": "/suite-api/api/resources/7b891296-9ade-47fa-9d23-d56071fb8b3d/stats/latest",
 "rel": "RELATED",
 "name": "latestStatsOfResource"
 },
 {
 "href": "/suite-api/api/resources/7b891296-9ade-47fa-9d23-d56071fb8b3d/properties",
 "rel": "RELATED",
 "name": "latestPropertiesOfResource"
 },
 {
 "href": "/suite-api/api/credentials/",
 "rel": "RELATED",
 "name": "credentialsOfResource"
 }
 ],
 "identifier": "7b891296-9ade-47fa-9d23-d56071fb8b3d"
}
Parsed Response Body
We should have a new Application object now. From the response, we need to store the value of “identifier” in the response in the variable named applicationObjectId using another Postman Test. In this example applicationObjectId = 7b891296-9ade-47fa-9d23-d56071fb8b3d.
Start Collecting Application Object
The Application object is created in a not collecting state, so we need to start collection.
Request
PUT https://{{vrops}}/suite-api/api/resources/{{applicationObjectId}}/monitoringstate/start
There is no payload returned with this request, but you should notice that the Application object is now collecting.
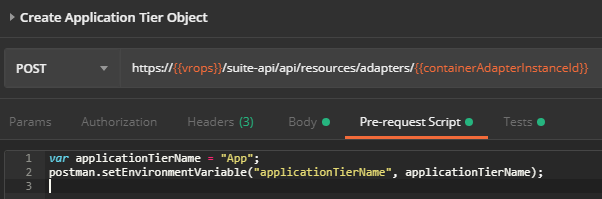
Create Application Tier Object
Now that we have an application, we need to create an Application Tier. This request is very similar to the one we used to create the Application object. I’ve used a pre-request script again in Postman to store the application tier name, “App” in the variable named applicationTierName on the Pre-request Script tab.
![]()
Request
POST https://{{vrops}}/suite-api/api/resources/adapters/{{containerAdapterInstanceId}}
Request Body
In the request body below, “{{applicationTierName}}” represents the name of the application being created, which is automatically replaced by the value entered in the Pre-request Script tab.
{
 "creationTime": null,
 "resourceKey": {
 "name": "{{applicationTierName}}",
 "adapterKindKey": "Container",
 "resourceKindKey": "Tier",
 "resourceIdentifiers": [
 {
 "identifierType": {
 "name": "BS_Tier Name",
 "dataType": "STRING",
 "isPartOfUniqueness": true
 },
 "value": "{{applicationObjectId}}_{{applicationTierName}}"
 }
 ]
 },
 "resourceStatusStates": [],
 "resourceHealth": null,
 "resourceHealthValue": null,
 "dtEnabled": true,
 "monitoringInterval": 5,
 "badges": [],
 "relatedResources": [],
 "identifier": null
}
Response
{
 "resourceKey": {
 "name": "App",
 "adapterKindKey": "Container",
 "resourceKindKey": "Tier",
 "resourceIdentifiers": [
 {
 "identifierType": {
 "name": "BS_Tier Name",
 "dataType": "STRING",
 "isPartOfUniqueness": true
 },
 "value": "7b891296-9ade-47fa-9d23-d56071fb8b3d_App"
 }
 ]
 },
 "resourceStatusStates": [],
 "dtEnabled": true,
 "monitoringInterval": 5,
 "badges": [],
 "relatedResources": [],
 "links": [
 {
 "href": "/suite-api/api/resources/3f7f0628-6173-4a95-9103-bfc262cd9c51",
 "rel": "SELF",
 "name": "linkToSelf"
 },
 {
 "href": "/suite-api/api/resources/3f7f0628-6173-4a95-9103-bfc262cd9c51/relationships",
 "rel": "RELATED",
 "name": "relationsOfResource"
 },
 {
 "href": "/suite-api/api/resources/3f7f0628-6173-4a95-9103-bfc262cd9c51/properties",
 "rel": "RELATED",
 "name": "propertiesOfResource"
 },
 {
 "href": "/suite-api/api/alerts?resourceId=3f7f0628-6173-4a95-9103-bfc262cd9c51",
 "rel": "RELATED",
 "name": "alertsOfResource"
 },
 {
 "href": "/suite-api/api/symptoms?resourceId=3f7f0628-6173-4a95-9103-bfc262cd9c51",
 "rel": "RELATED",
 "name": "symptomsOfResource"
 },
 {
 "href": "/suite-api/api/resources/3f7f0628-6173-4a95-9103-bfc262cd9c51/statkeys",
 "rel": "RELATED",
 "name": "statKeysOfResource"
 },
 {
 "href": "/suite-api/api/resources/3f7f0628-6173-4a95-9103-bfc262cd9c51/stats/latest",
 "rel": "RELATED",
 "name": "latestStatsOfResource"
 },
 {
 "href": "/suite-api/api/resources/3f7f0628-6173-4a95-9103-bfc262cd9c51/properties",
 "rel": "RELATED",
 "name": "latestPropertiesOfResource"
 },
 {
 "href": "/suite-api/api/credentials/",
 "rel": "RELATED",
 "name": "credentialsOfResource"
 }
 ],
 "identifier": "3f7f0628-6173-4a95-9103-bfc262cd9c51"
}
Parsed Response Body
We should have a new Application Tier object now. From the response, we need to store the value of “identifier” in the response in the variable named applicationTierObjectId using another Postman Test. In this example applicationTierObjectId = 3f7f0628-6173-4a95-9103-bfc262cd9c51.
Start Collecting Application Tier Object
Just like with the Application object, we need to start collection for the newly created Application Tier object
Request
PUT https://{{vrops}}/suite-api/api/resources/{{applicationTierObjectId}}/monitoringstate/start
There is no payload returned with this request, but you should notice that the Application object is now collecting.
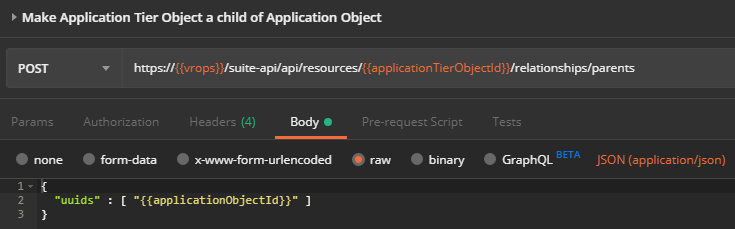
Make Application Tier Object a Child of Application Object
Now the Application Tier object needs to become a child of the Application object.
![]()
Request
POST https://{{vrops}}/suite-api/api/resources/{{applicationTierObjectId}}/relationships/parents
Request Body
{
 "uuids": [
 "{{applicationObjectId}}"
 ]
}
Response
There is no payload returned for this call.
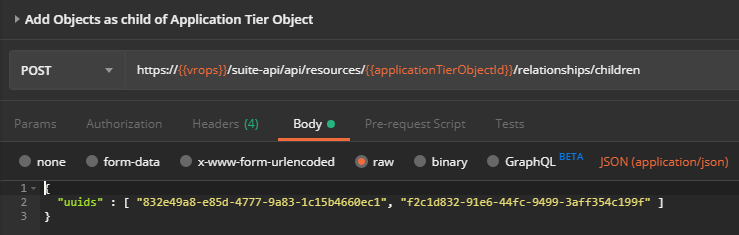
Add Objects as Child of Application Tier Object
The last step for Application Tiers is to add objects as children of the newly created Application Tier object.
![]()
Request
POST https://{{vrops}}/suite-api/api/resources/{{applicationTierObjectId}}/relationships/children
Request Body
The request body contains an array of IDs for objects that will be added to the Application Tier.
{
 "uuids": [
 "832e49a8-e85d-4777-9a83-1c15b4660ec1",
 "f2c1d832-91e6-44fc-9499-3aff354c199f"
 ]
}
Response
There is no payload returned for this call.
Add Additional Application Tiers
If you have additional application tiers to add, go back to Create Application Tier Object to create another tier.
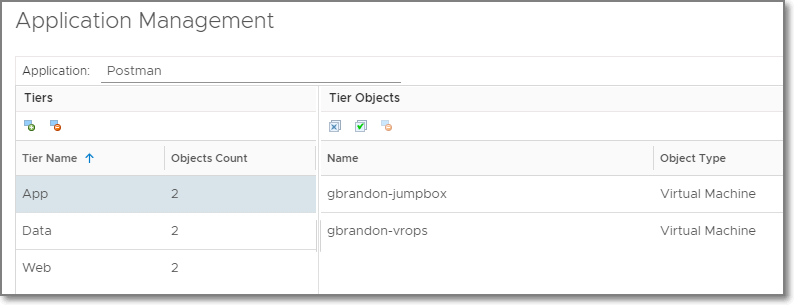
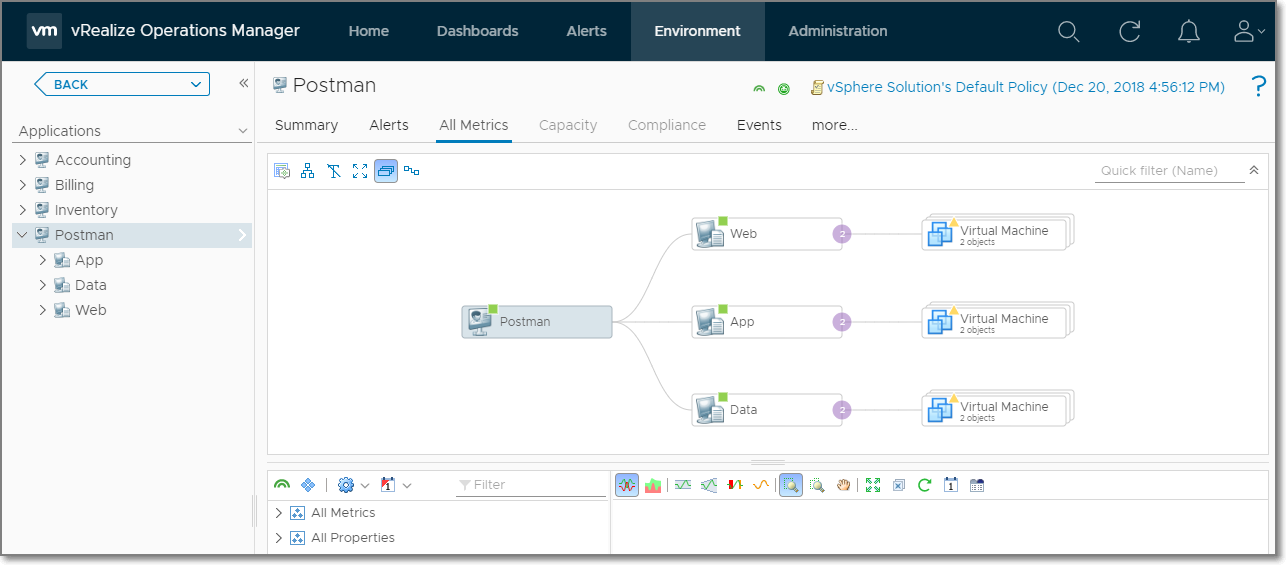
Conclusion
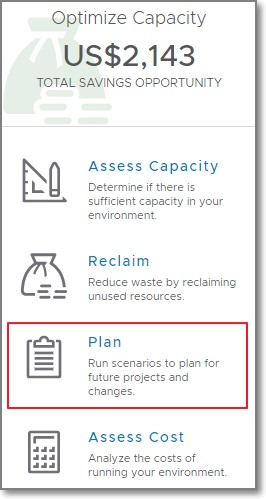
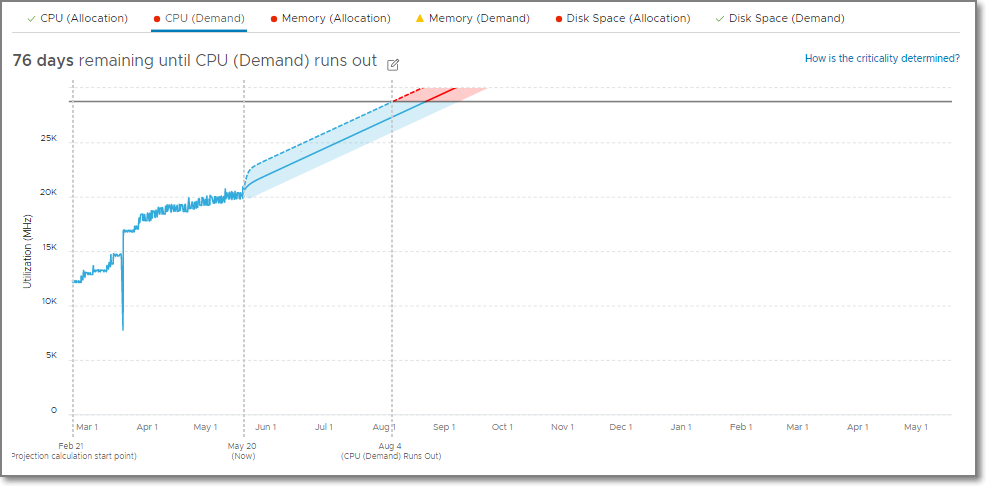
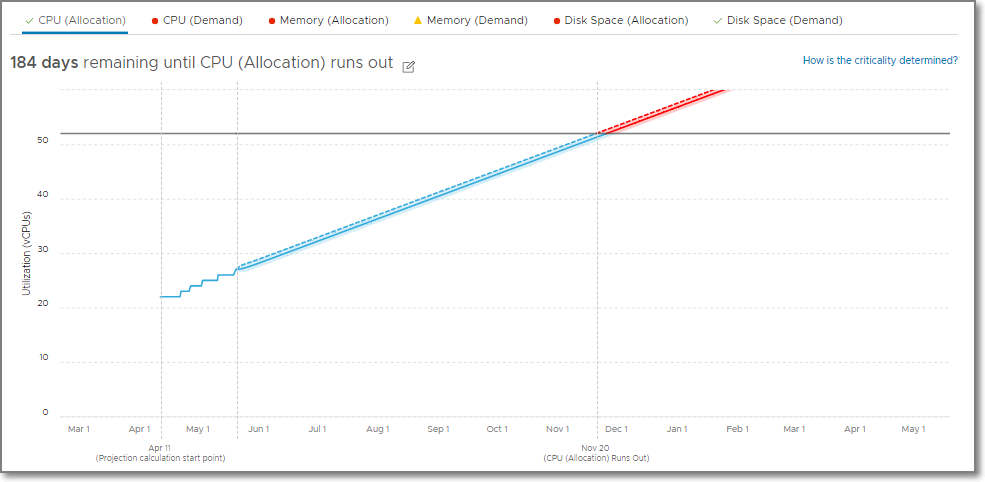
![]()
![]()
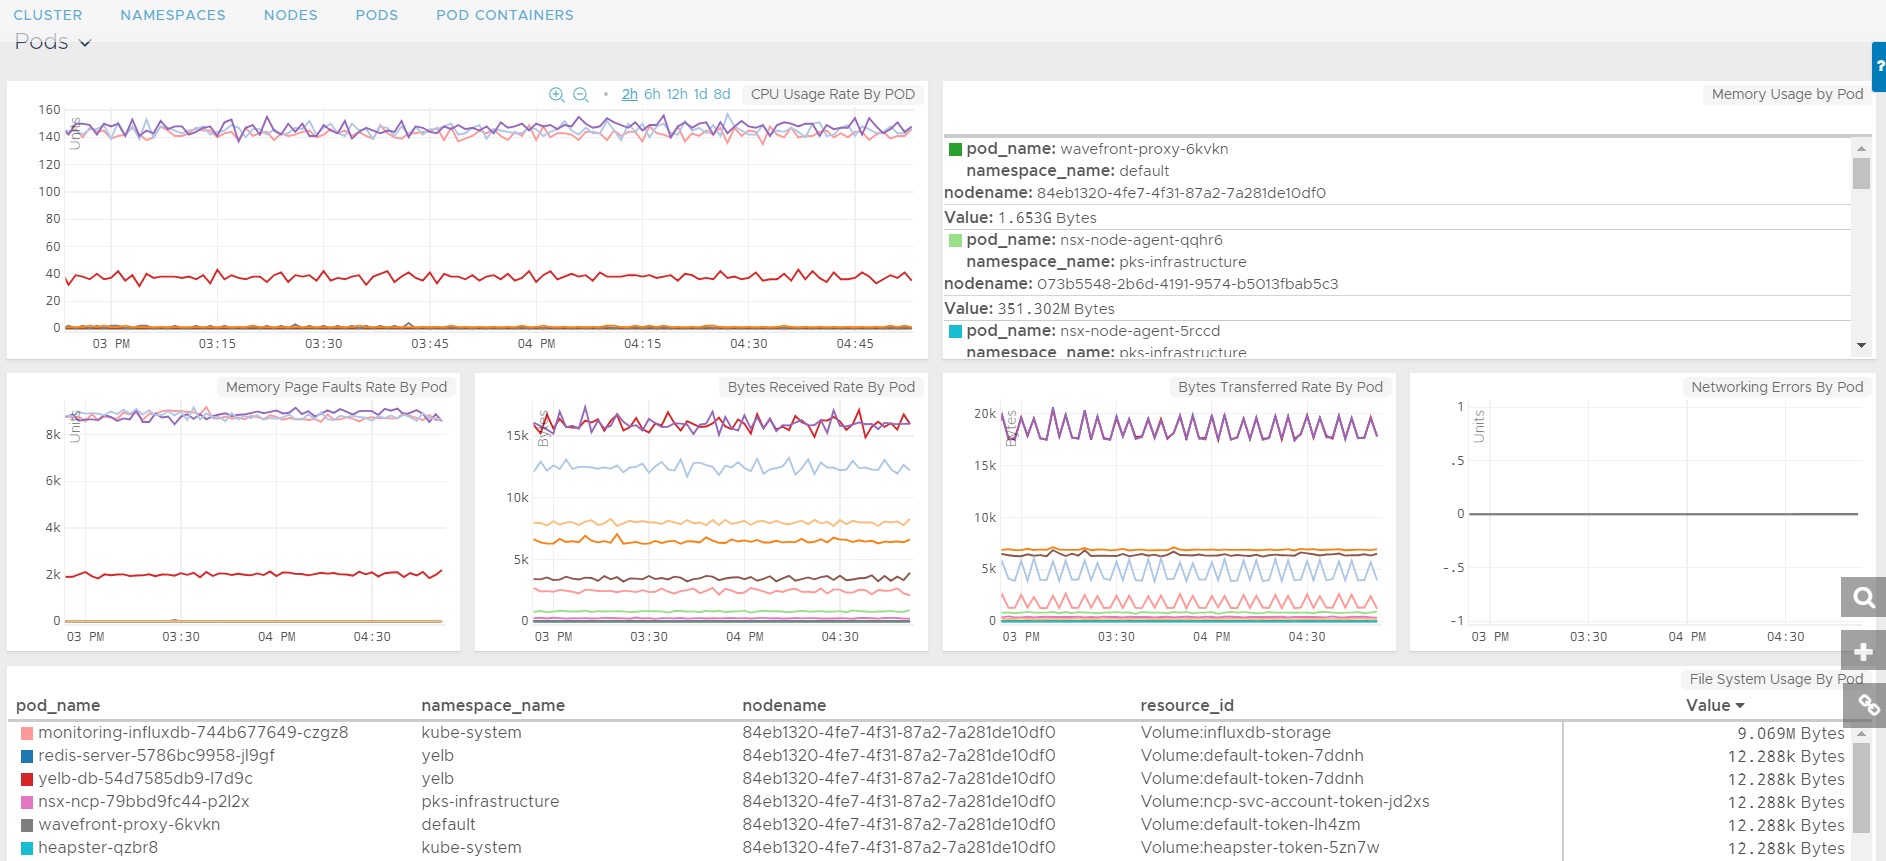
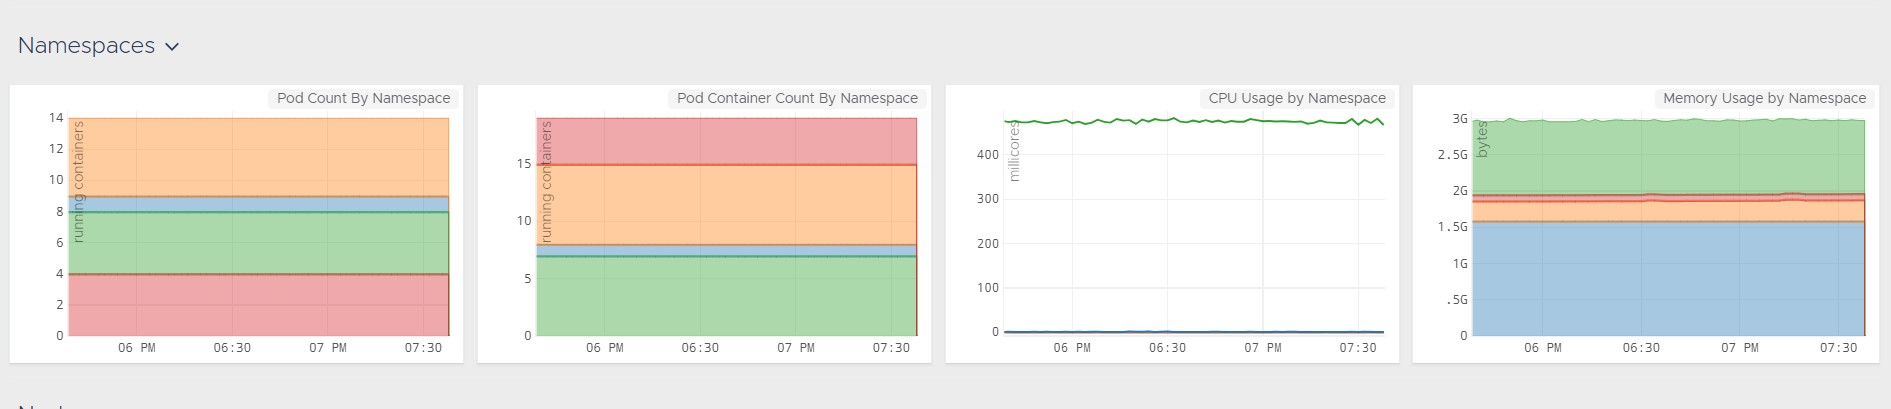
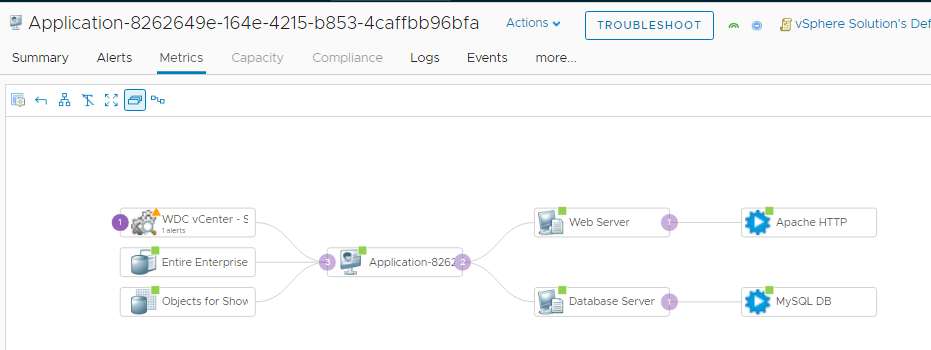
We’ve finally made it to the end by creating a multi-tier application within vRealize Operations using only the public REST APIs. This process can be done during deployment of VMs with Cloud Automation Service or vRealize Automation to give you the context needed to monitor applications in your environment. If you don’t have vRealize Operations today, you can download a trial of vRealize Operations 7.5 and try it out in your environment! You can also find more demos and videos on vrealize.vmware.com.
The post vRealize Operations REST API: Create Application and Application Tier Objects appeared first on VMware Cloud Management.