Rightsizing VMs is critical to get the best performance of your vSphere infrastructure and your VMs. Rampant oversizing of VMs can cause contention at the host or cluster level, which manifest as CPU ready, CPU co-stop, VM swap, etc. Undersized VMs can cause contention inside the guest OS, which manifest as CPU queuing, memory paging, etc. Rightsizing VMs helps you achieve the best performance of the infrastructure and VMs. In this blog post I’d like to show you why I feel that vRealize Operations is the best tool available for VM rightsizing.
The first thing I’d like to cover is the difference between rightsizing and reclamation. Rightsizing is when you change the amount of resources allocated to a VM match the utilization requirements of the VM. For example, adding a vCPU if the VM is running high CPU utilization or removing memory if the server is not using all of its allocated memory. Reclaim on the other hand is deleting powered off or idle VMs, old snapshots, or orphaned disks. The main difference is that rightsizing is done for performance reasons and reclaim is done for capacity reasons. The difference in use cases are why they’re located in different pillars on the Quick Start page.
Rightsizing
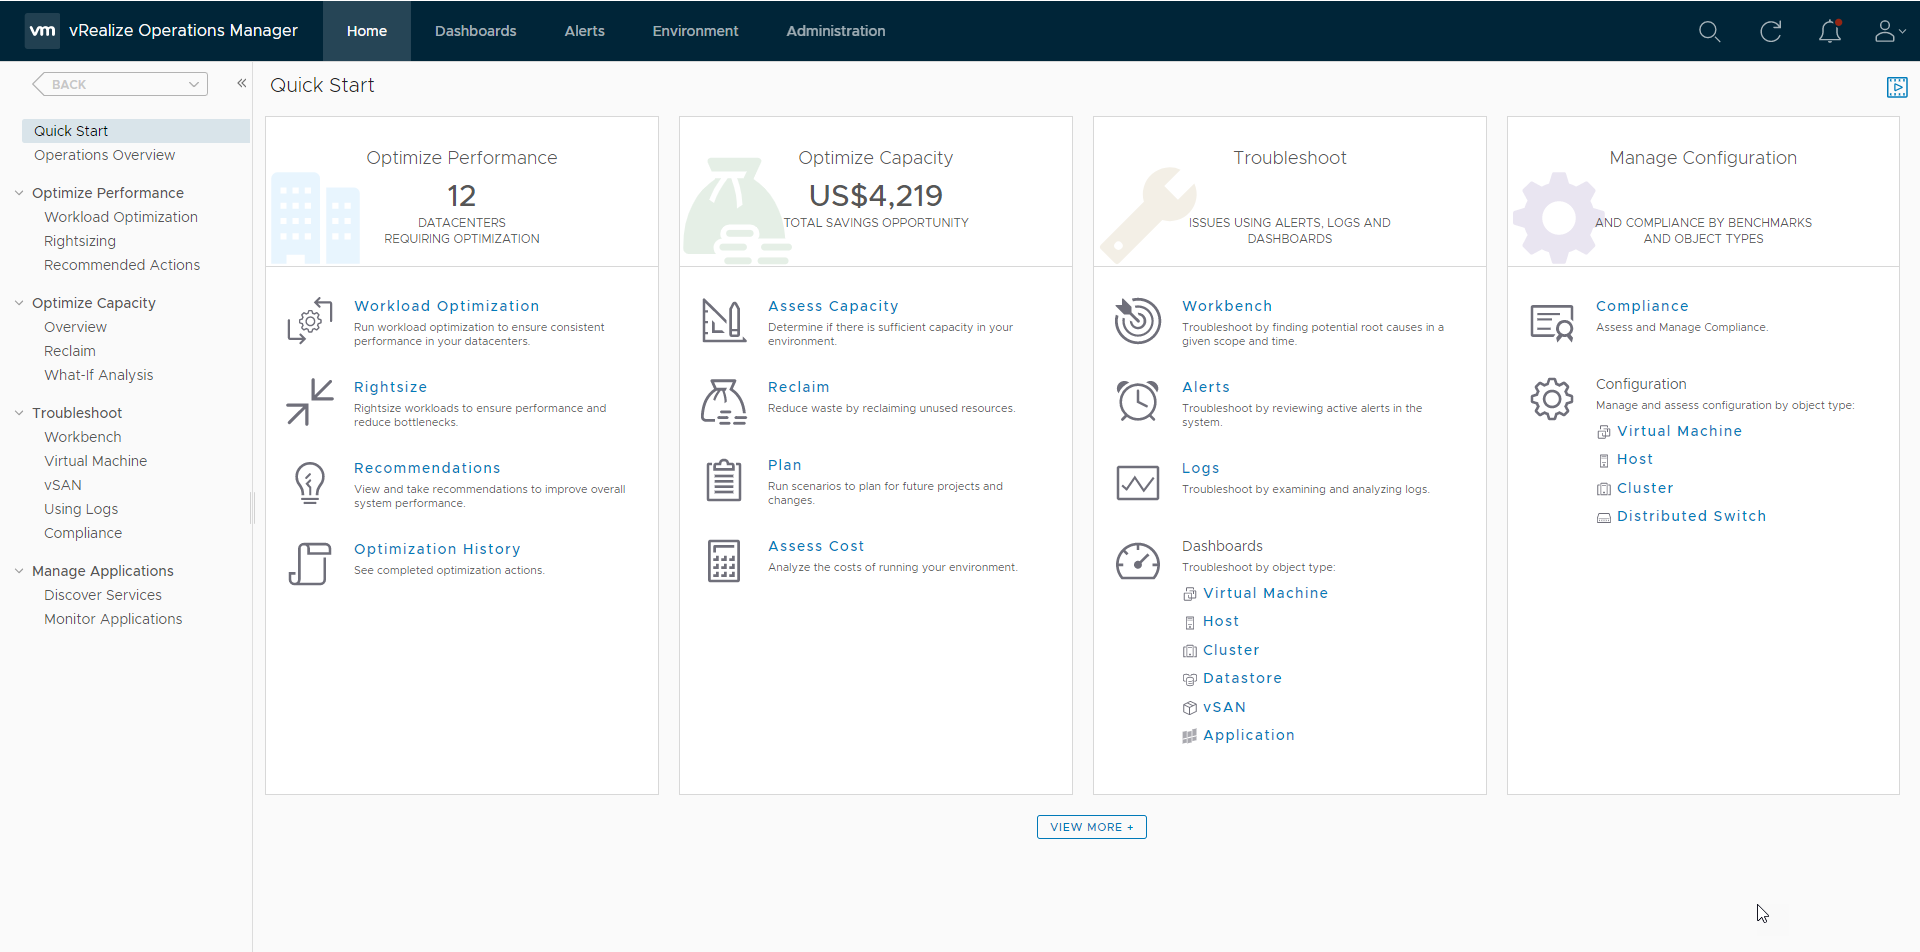
To start you on your rightsizing adventure, you should start on the Quick Start page that you are greeted with when you logon to vRealize Operations.
![]()
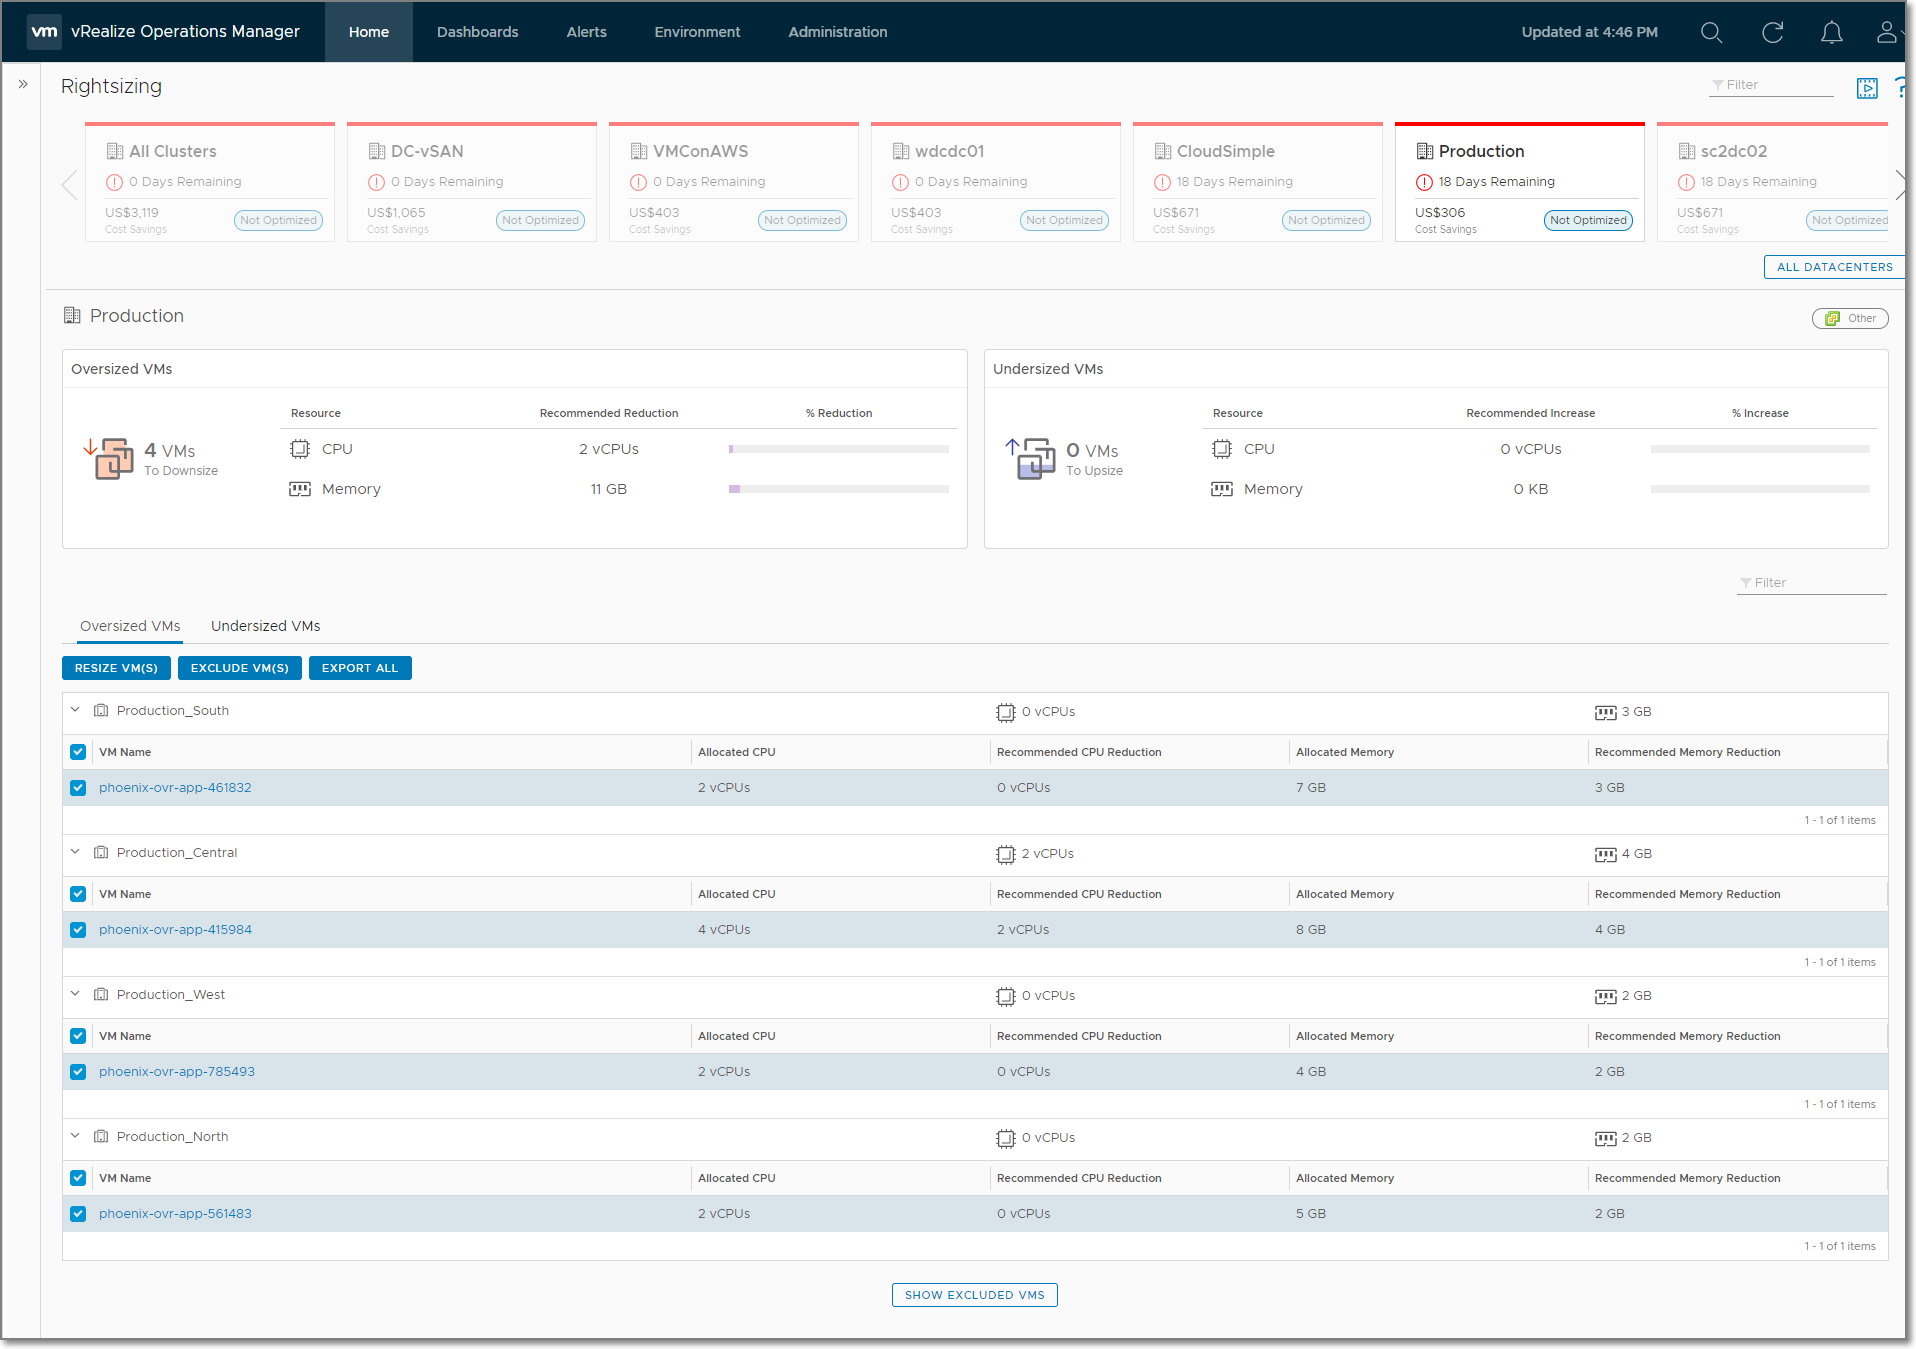
Oversized VMs
Once you’re in the Rightsizing page, you will be presented a summary of Oversized an Undersized VMs. By expanding the Oversized VMs section at the bottom, you can see all of the VMs that have been identified as oversized. You can select one or more VMs and resize them without leaving vRealize Operations by clicking on Resize VM(s) button. By initiating the resize action from here, vRealize Operations automatically uses its connection to vCenter to make the changes to the VM. It’s even aware of hot-add, and will skip a reboot if the VM if hot-add is enabled.
If by chance, you see a VM that you want to leave oversized and you don’t want’ to be notified about it anymore, just select the VM and click Exclude VM(s). If you have a lot of VMs that you wish to exclude, you can use the Filter box to reduce the list of VMs shown (e.g VMs containing “xyz” in their name), then use the select all button to exclude VMs in bulk. You can always include the VM again by expanding Show Excluded VMs at the bottom of the page.
![]()
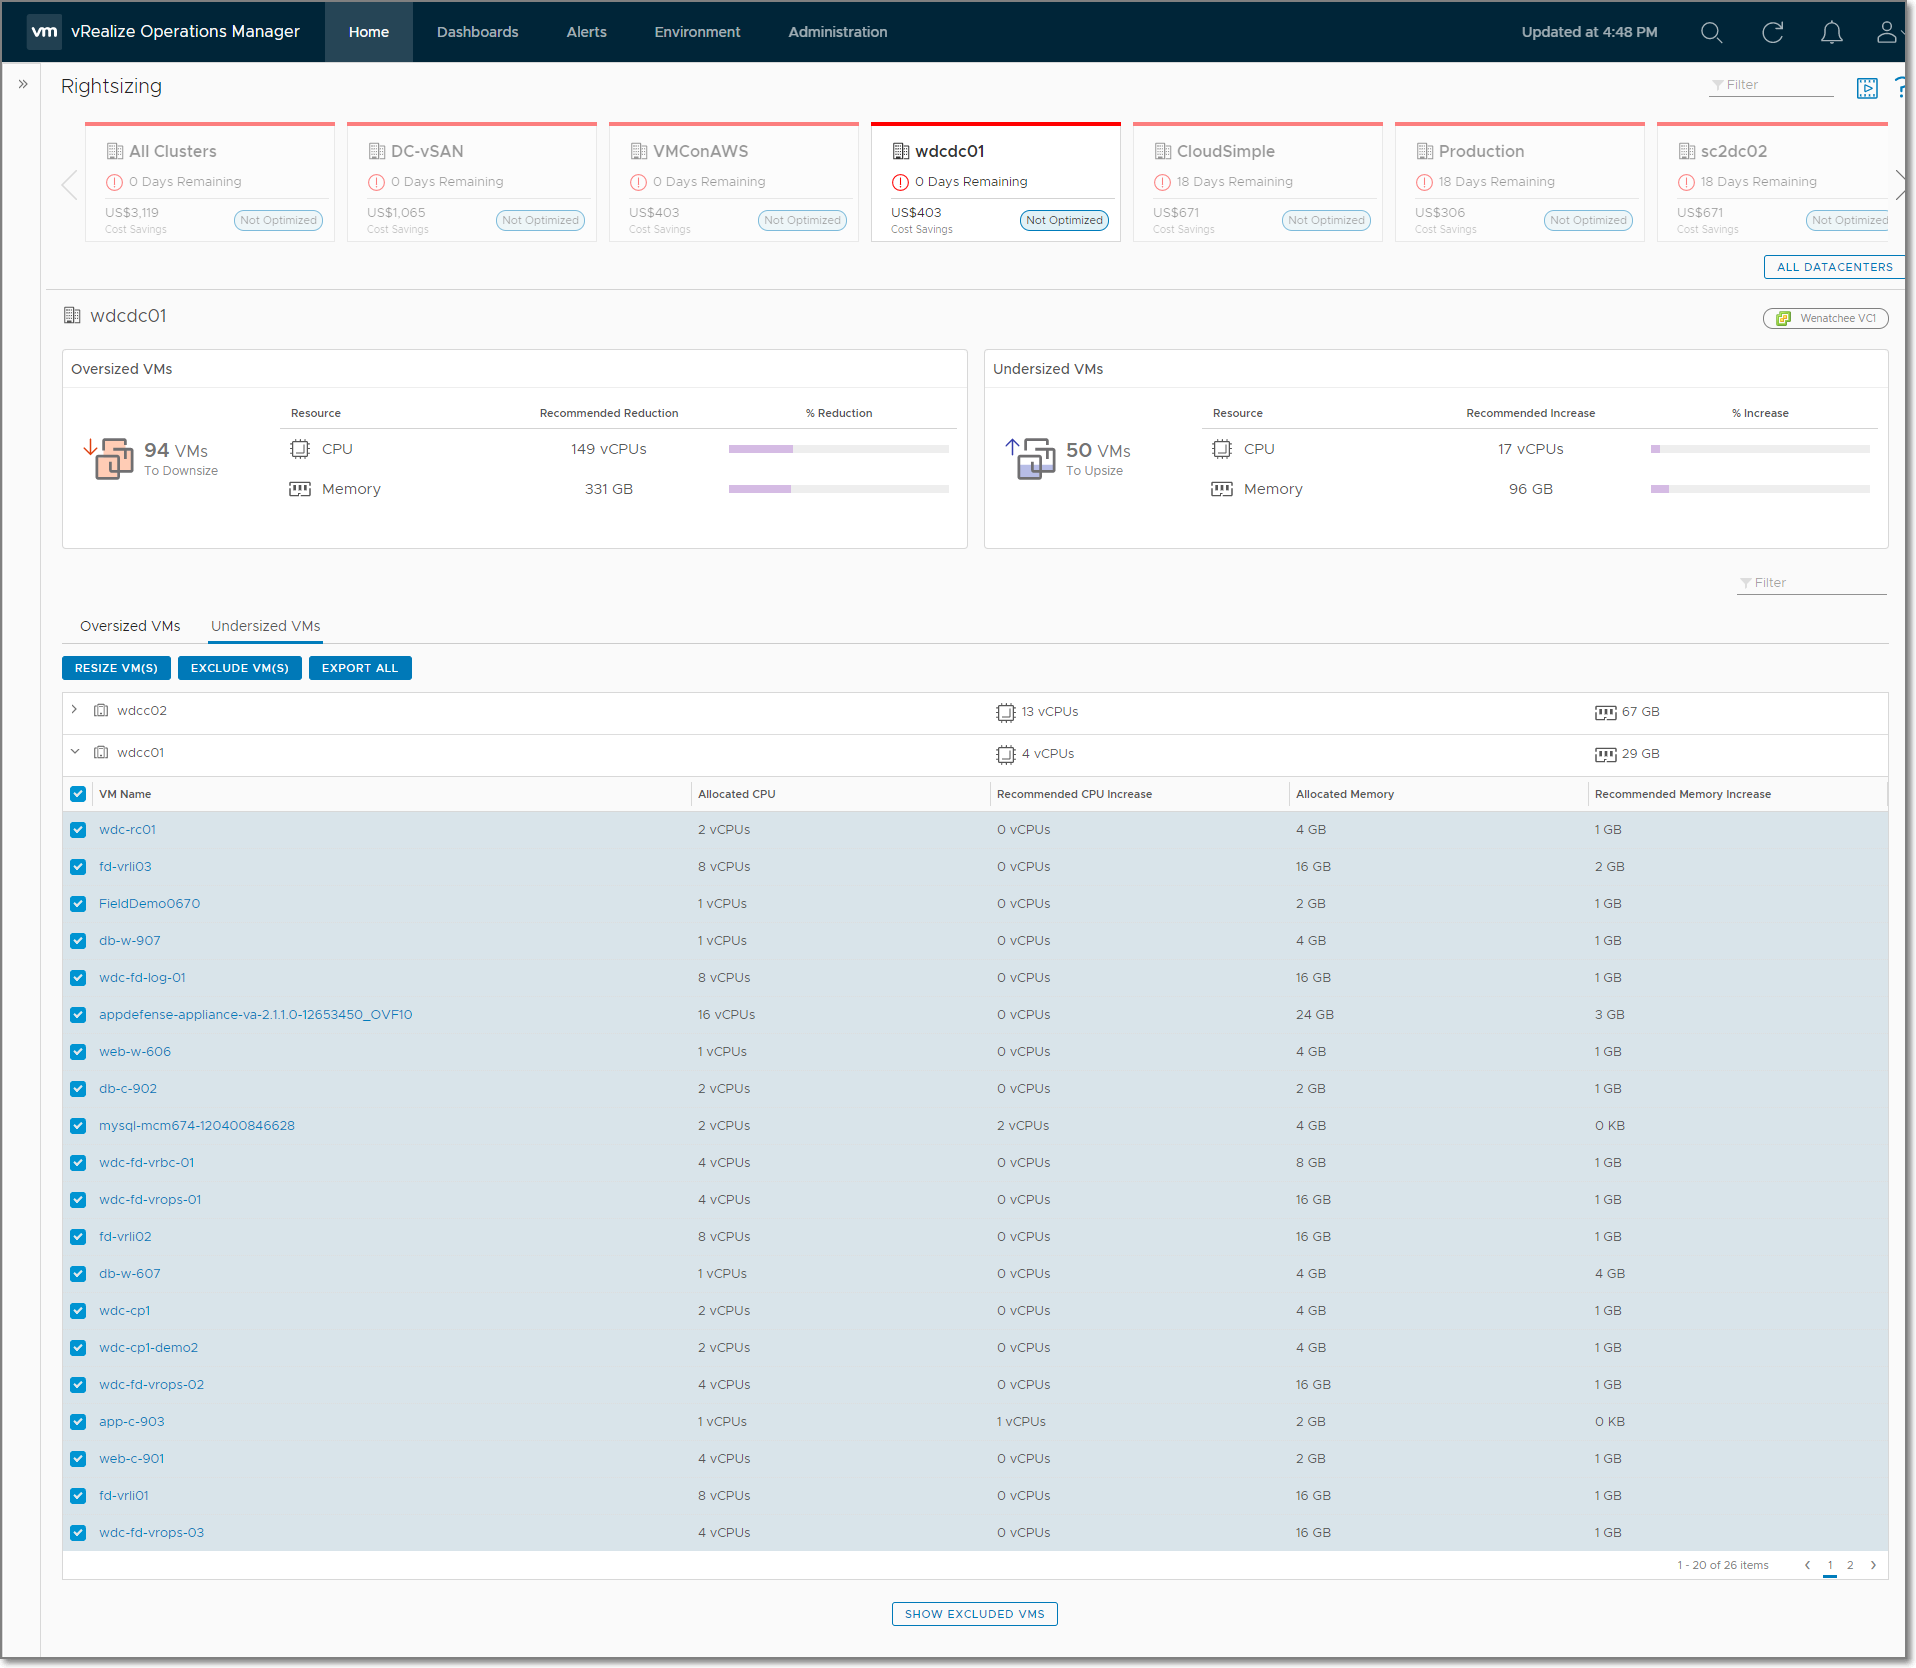
Undersized VMs
By clicking on the Undersized VMs section at the bottom, you can see all of the VMs that have been identified as undersized. This page works the same as the Oversized VM section. Click Resize VM(s) to resize the VMs in vCenter and Exclude VM(s) to remove them from the list.
![]()
Calculating Recommended Size
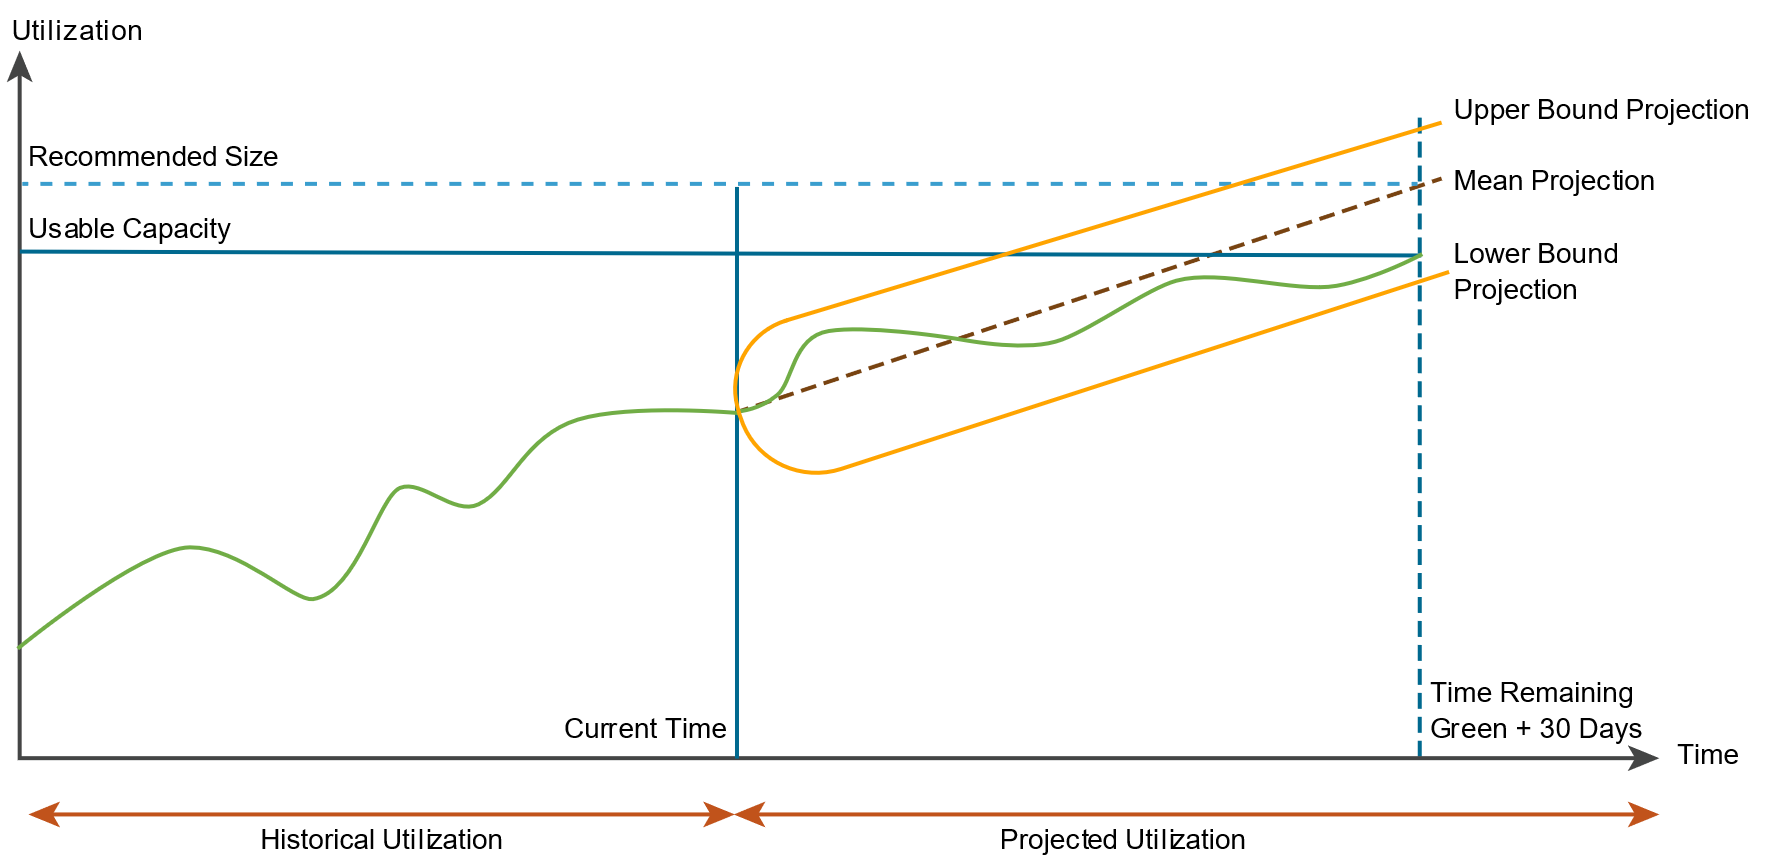
Now that I’ve shown how rightsizing works in the UI, I’d like to explain how vRealize Operations creates the recommended size for VMs. The capacity engine built into vRealize Operations leverages AI/ML technologies to create forward looking projections of the future utilization of VMs. It’s those projections that are used to determine the Recommended Size of VMs. The recommendations are not simply based on historical utilization of the VM.
There are two primary settings that affect Recommended Size for VMs, Time Remaining Risk Level and Time Remaining Score Threshold.
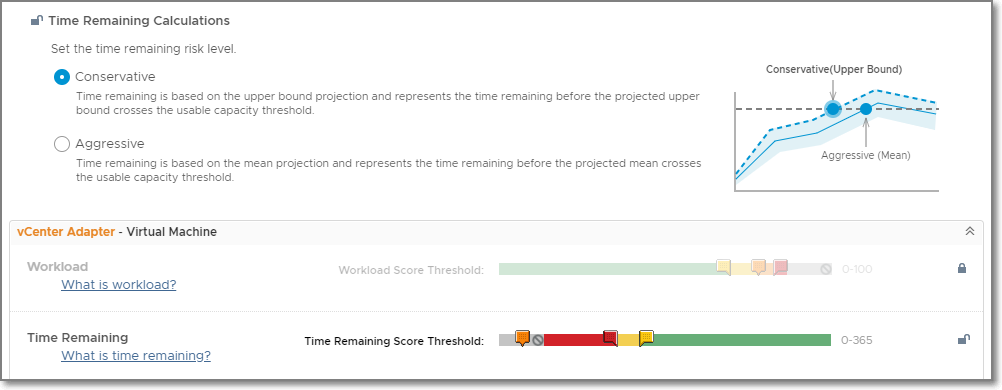
Conservative Time Remaining Risk Level
Setting the Time Remaining Risk Level to Conservative tells vRealize Operations to use the Upper Bound Projection when determining the Recommended Size. This can be set on the capacity overview page or in policies. Conservative is the default, and is recommended for critical environments such as production or business critical applications.
Time Remaining Score Threshold tells vRealize Operations what point in the projection to use rightsize the VM based on the number of days until the VM goes below the green threshold. The default is 120 days for yellow (warning) and 90 days for red (critical). This can be changed in policies for Virtual Machine objects.
![]()
Recommended Size, when configured for Conservative, is the recommended Usable Capacity to maintain a green state based the Upper Bound Projection. The VM needs to maintain a green state for the entire time between now and the Green Time Remaining Score Threshold set in the policy + 30 Days. The Green Time Remaining Score Threshold defaults to 120 days, so the default Recommended Size window covers the Upper Bound Projection from now to 150 days in the future.
![]()
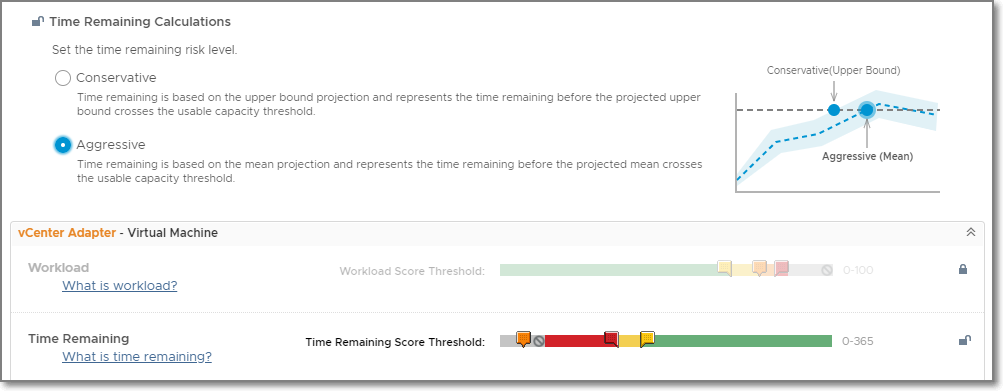
Aggressive Time Remaining Risk Level
Setting the Time Remaining Risk Level to Aggressive tells vRealize Operations to use the Mean of the Upper Bound and Lower Bound Projections when determining the Recommended Size. This can be set on the capacity overview page or in policies. Aggressive is not the default, but it can be enabled for less critical environments such as development, UAT, or test.
Time Remaining Score Threshold tells vRealize Operations what point in the projection to use rightsize the VM based on the number of days until the VM goes below the green threshold. The default is 120 days for yellow (warning) and 90 days for red (critical). This can be changed in policies for Virtual Machine objects.
![]()
Recommended Size, when configured for Aggressive, is the recommended Usable Capacity to maintain a green state based the Mean Projection. The VM needs to maintain a green state for the entire time between now and the Green Time Remaining Score Threshold set in the policy + 30 Days. The Green Time Remaining Score Threshold defaults to 120 days, so the default Recommended Size window covers the Mean Projection from now to 150 days in the future.
![]()
Recommended Size Limits
Customers often aren’t keen on making substantial changes to VMs and are looking for a more conservative approach. Recommended Size has been designed to be conservative in its recommendations as well.
Recommended Size for oversized VMs are capped at 50% of the current allocation while Recommended Size for undersized VMs are capped at 100% of the current allocation. This helps to gradually guide VMs to the Recommended Size without recommending substantial changes like 32 vCPUs down to 1 vCPU.
Historical Data
- Projection Calculation Start Point shows how much data is used to create the projection
- Exponential Decay gives higher weight to recent data points to allow the projection to react more quickly to recent changes in utilization
- Time Series Data Retention Global Setting does not impact capacity calculations
- Delete the object to reset projection calculation start point
![]()
Peaks
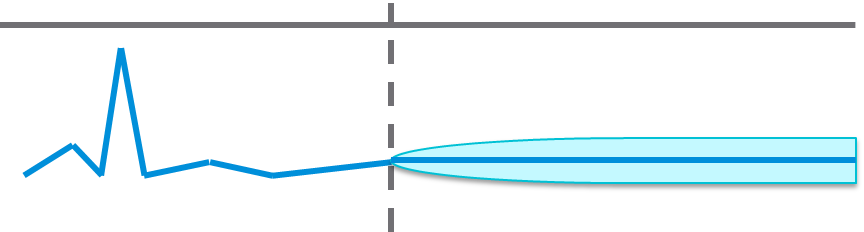
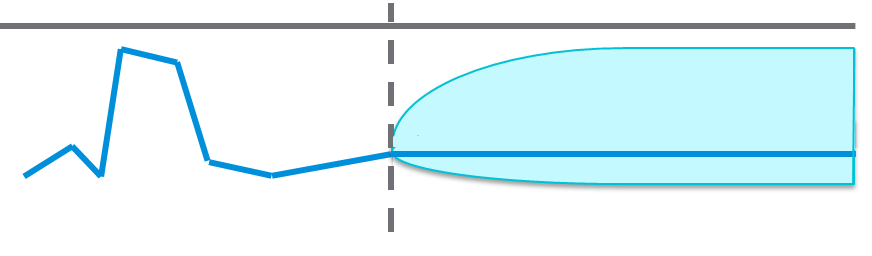
As you know, most workloads don’t follow a straight line for utilization. There can be various peaks in utilization over time that need to be accounted for in the projections. The impact of a peak on the projection is relative to the duration, height, and frequency of the peaks. Remember this is a projection created by the AI/ML powered capacity engine, so there isn’t a specific formula that I can give you to doublecheck the math. The way I like to explain it is, as a human looking at the historical utilization, ask yourself if the peak look significant enough to affect capacity planning and are there enough peaks that they appear to follow periodic pattern(s)? If so, you should see the impact of those peaks in the projections. In general, the more important the peak(s) look, the more impact the peak(s) have on the projection.
- Momentary peaks that are short-lived and might be one-off. These are the peaks that you would dismiss for capacity planning purposes because they don’t appear important. In general, small and short-lived peaks should have minimal impact for capacity planning and therefore have minimal impact in the projection.
![]()
- Sustained peaks last for a longer time and do impact projections. If the peak is not periodic, the impact on the projection lessens over time due to exponential decay.
![]()
- Periodic peaks exhibit cyclical patterns or waves. For example, hourly, daily, weekly, monthly, last day of the month, etc. There can be multiple overlapping cyclical patterns, which will also be detected.
![]()
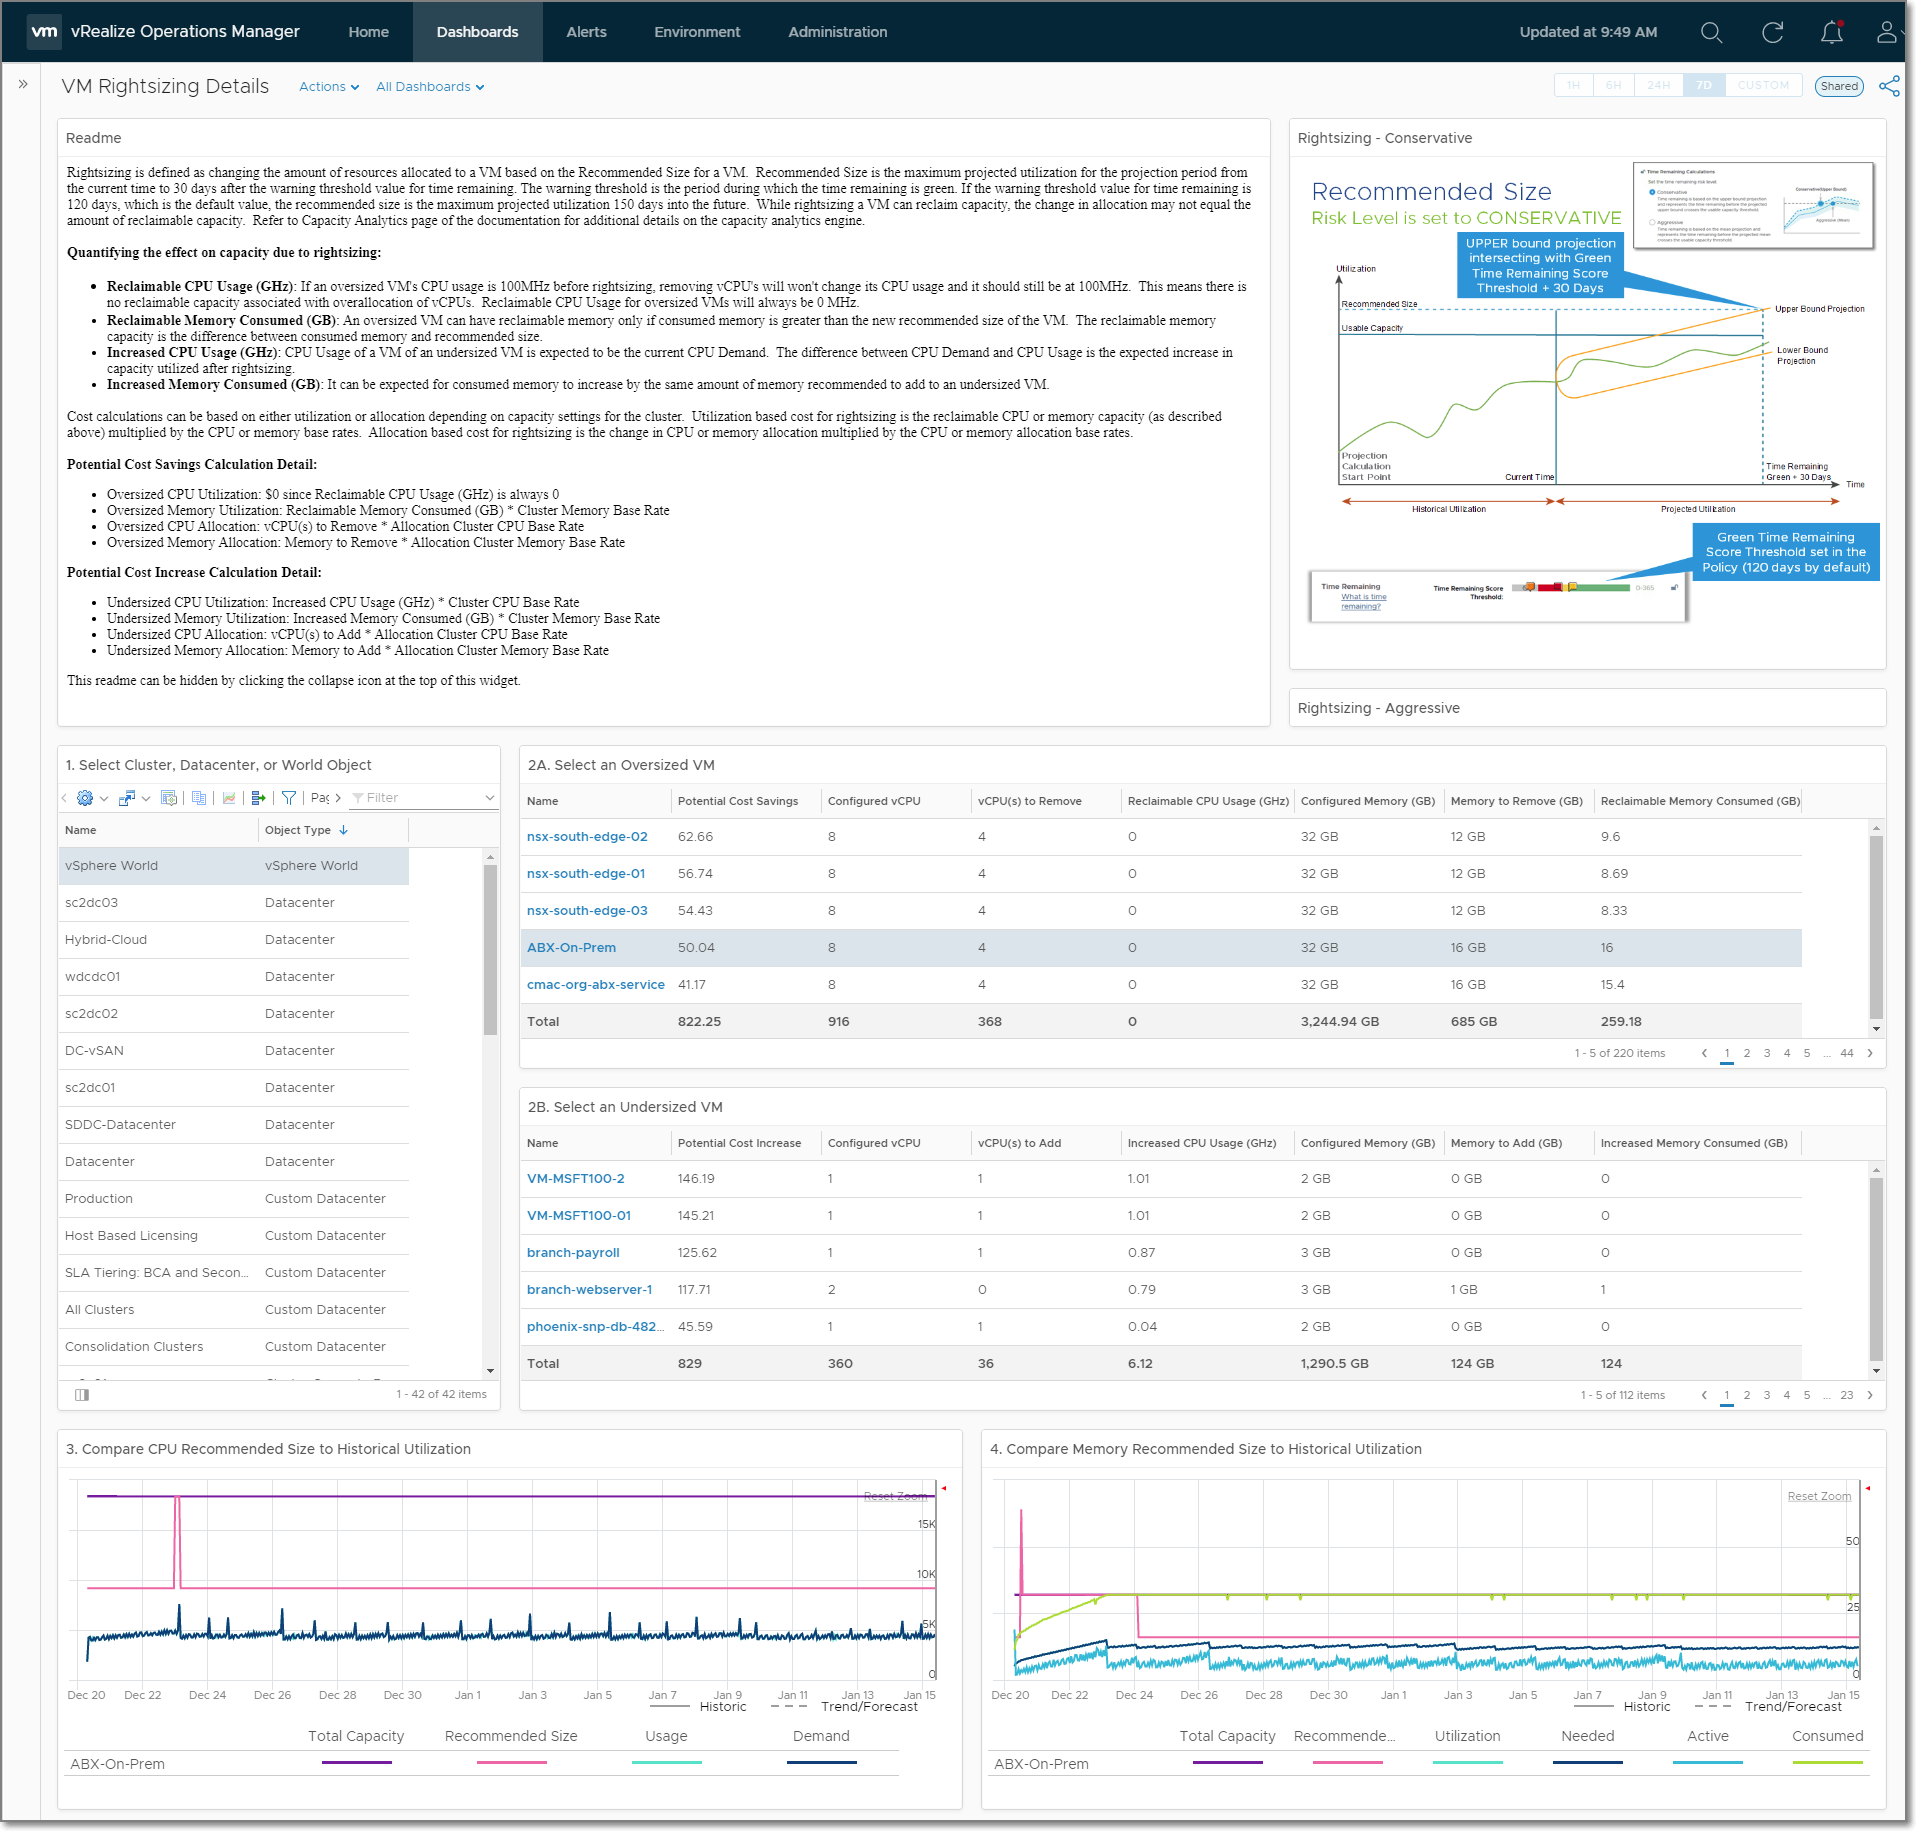
Custom VM Rightsizing Details Dashboard
There are several questions that I get asked frequently that can be addressed with some customization. To help answer those questions, I’d like to share a custom “Rightsizing Details” dashboard that I created. This custom “Rightsizing Details” dashboard, will help you address several use cases all within a single page. If you want to take advantage of this dashboard and you’re running vRealize Operations Advanced or Enterprise edition, you can download it from https://vrealize.vmware.com/sample-exchange/6791.
- How does vROps determine the recommended size for a VM?
- Which VMs are oversized?
- Which VMs are undersized?
- How do I justify the recommendation to the VM owner?
- What is the potential change to capacity if the VMs are rightsized?
- What is the potential change to VM cost if the VMs are rightsized?
![]()
How does vROps determine the recommended size for a VM?
To answer this question, I’ve added an extensive readme section directly in the dashboard. It’s not as in depth as this blog post, but there is a link to this blog post for users that wish to know more.
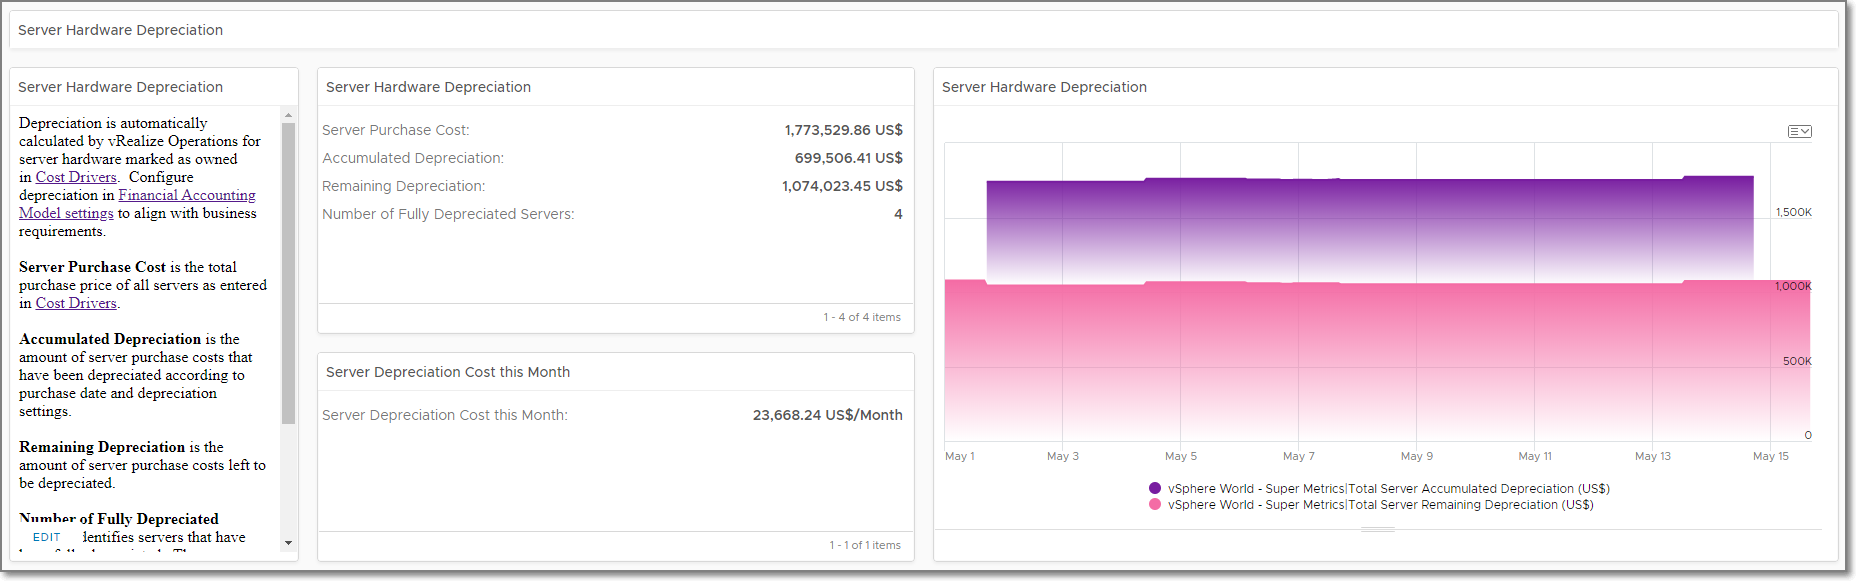
Which VMs are oversized?
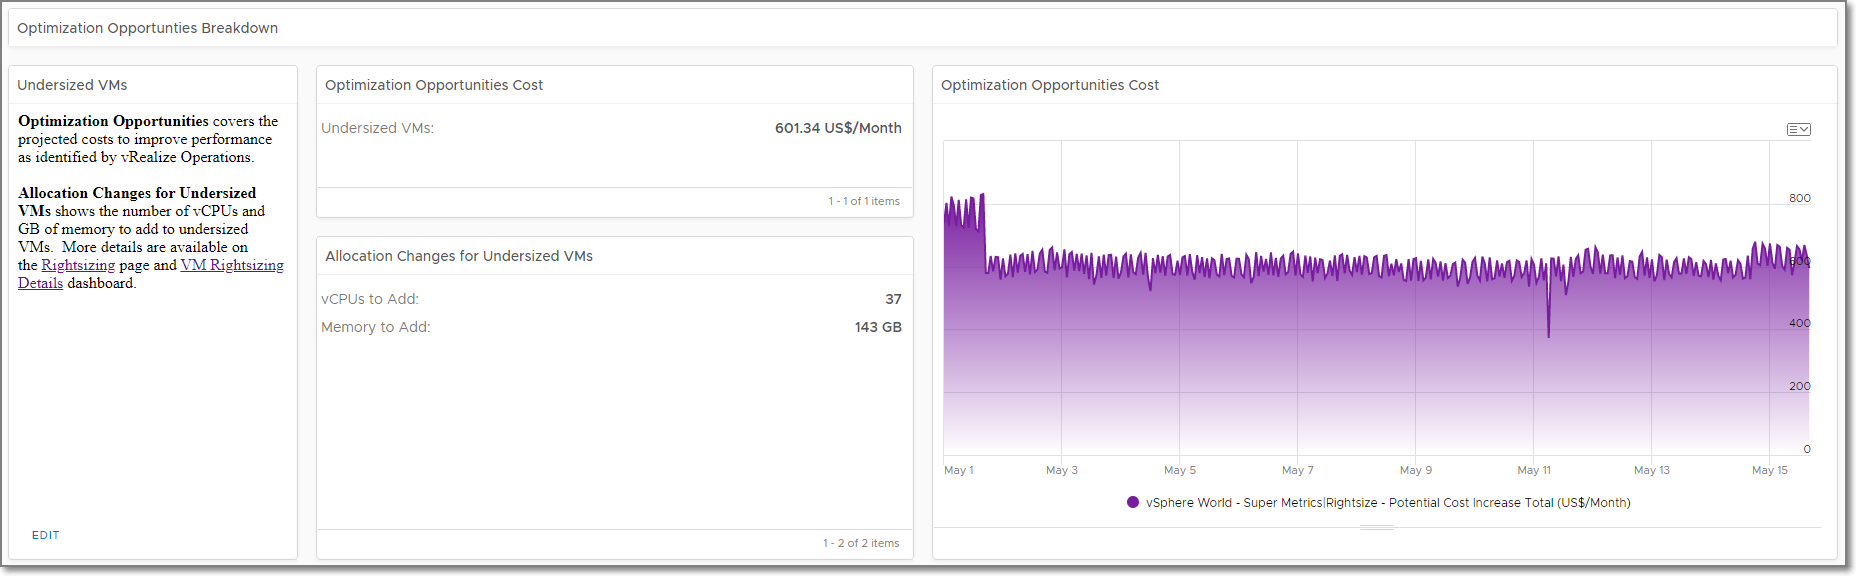
The first widget named Oversized VMs shows all of the VMs that have been detected as oversized. There are totals to show how much you can potentially reduce allocation of resources, additional capacity needed, and potential cost increase you should expect. The secondary goal of this widget is to help justify rightsizing to management.
Which VMs are undersized?
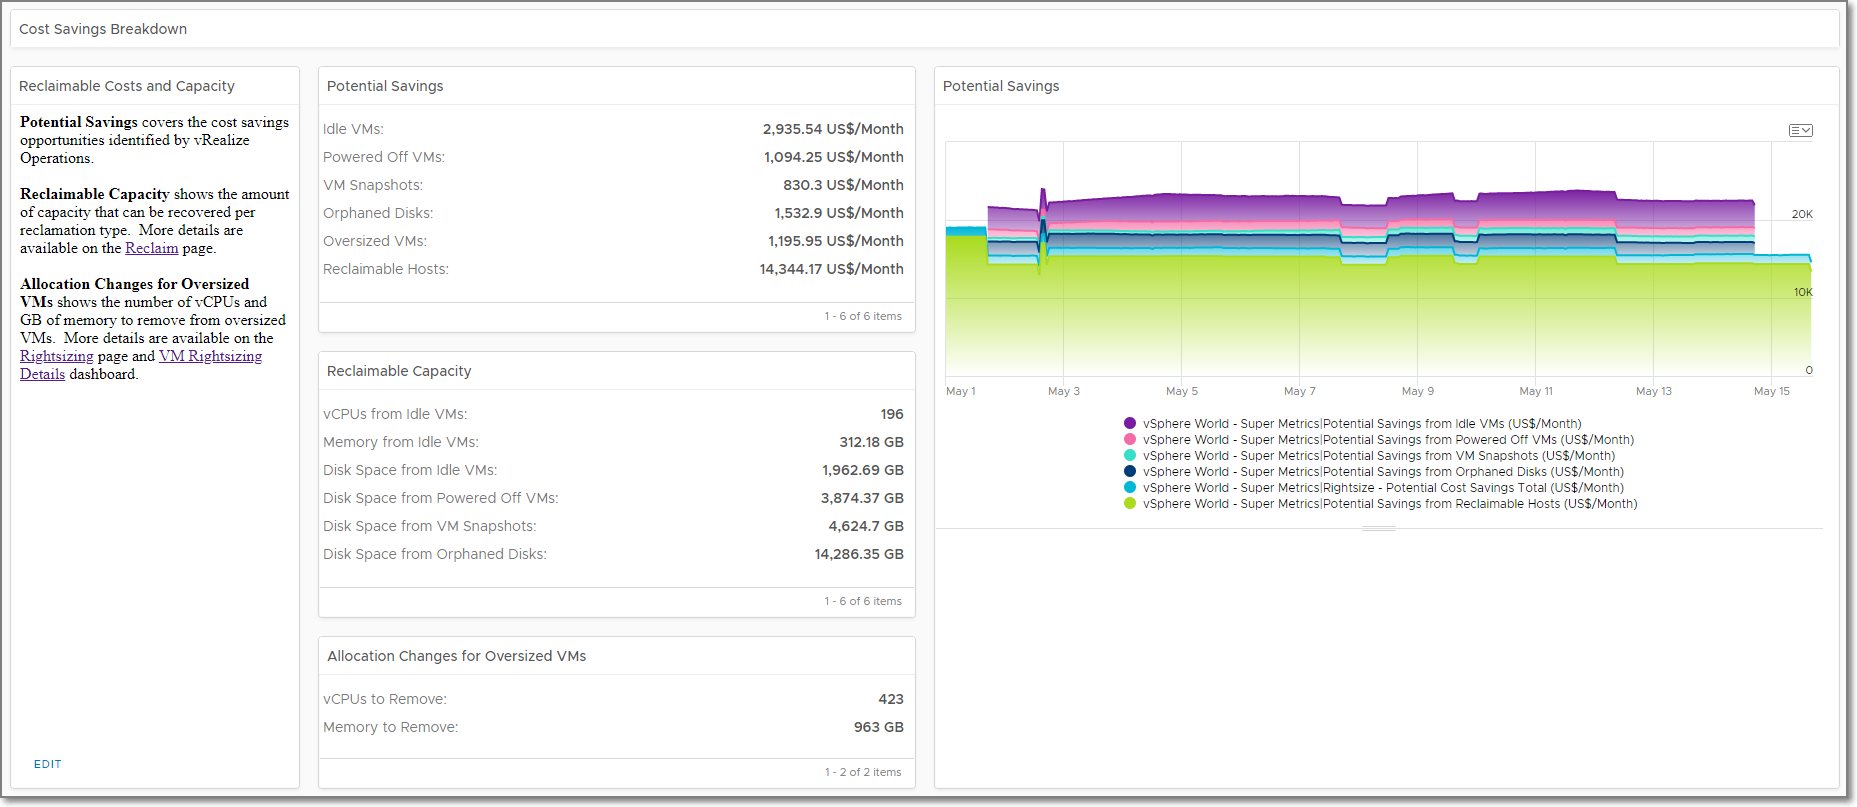
The Undersized VMs widget is works similar to the Oversized VMs widget. It shows all of the VMs that have been detected as undersized. There are totals to show how much you may need to increase allocation of resources, capacity you can reclaim, and potential cost savings you can achieve. The secondary goal of this widget is to help justify rightsizing to management in conjunction with addressing Oversized VMs.
How do I justify the recommendation to the VM owner?
To help justify rightsizing recommendations to VM or application owners, I’ve added Recommended Size – CPU and Recommended Size – Memory widgets. By selecting a VM in either Oversized VMs or Undersized VMs widgets, you’ll see a chart with the historical utilization of the VM along with the Recommended Size for the VM. These 2 charts should make the rightsizing conversation much easier with the VM or application owner.
What is the potential change to capacity if the VMs are rightsized?
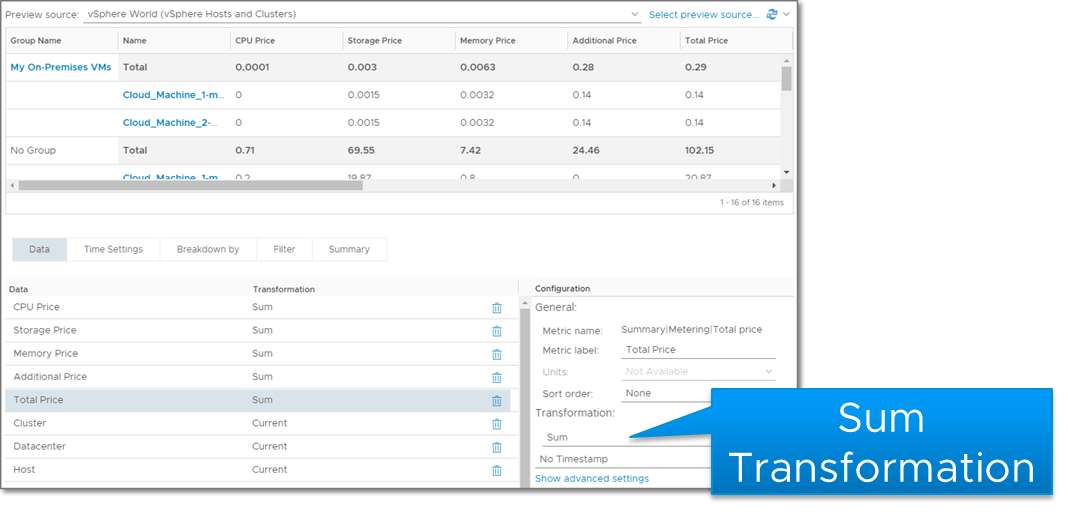
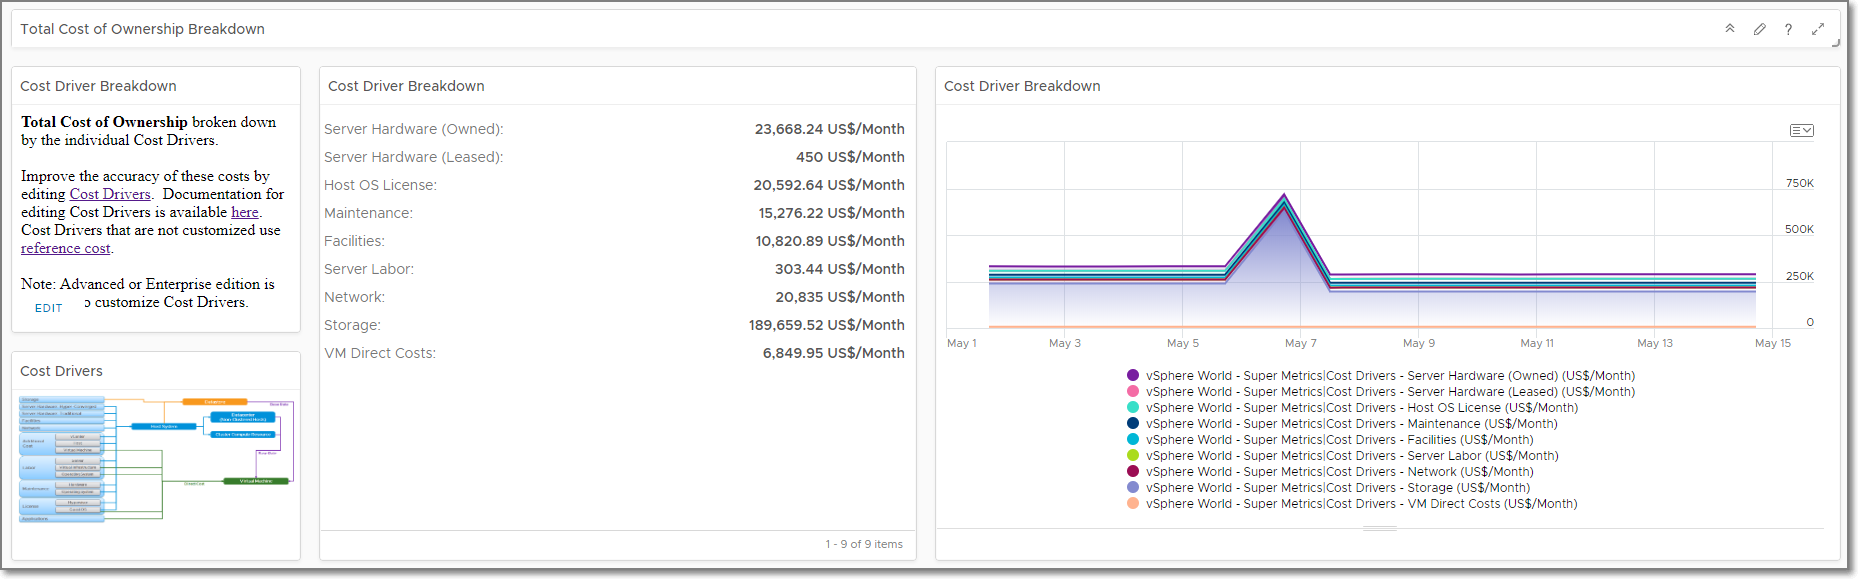
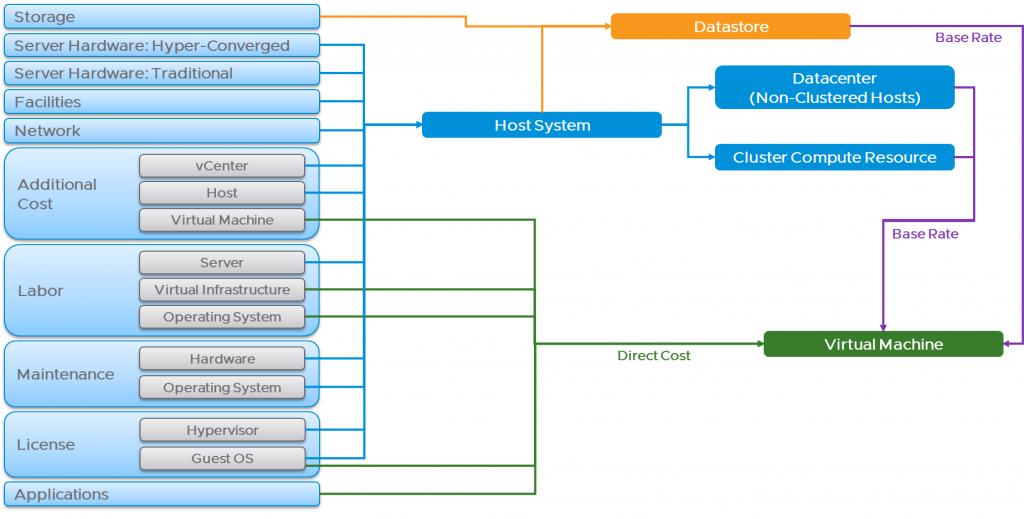
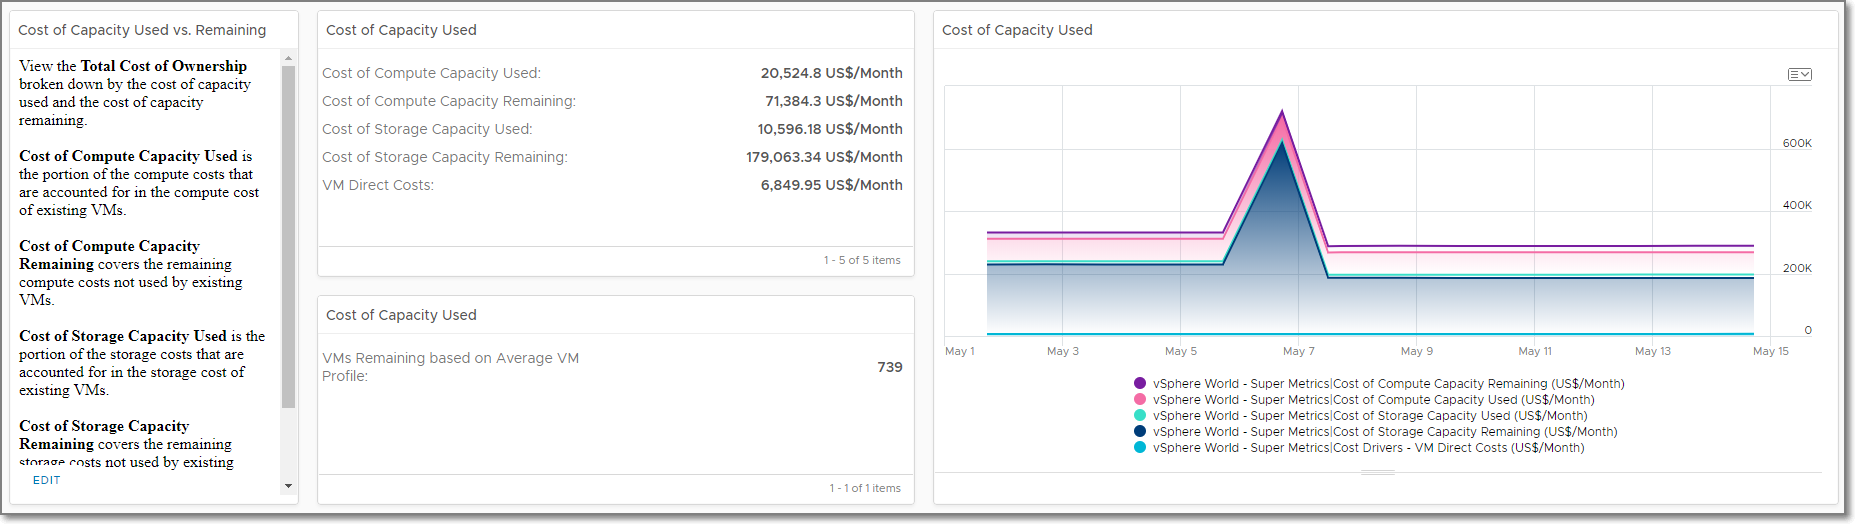
I am often asked to help quantify the overall impact to capacity if all VMs are rightsized. Answering that question is possible in vRealize Operations, but it requires Super Metrics to calculate them based on existing metrics. The key part to understand is that the change to capacity does not always correlate with the change in allocation of resources to a VM.
Reclaimable CPU Usage (GHz): If an oversized VM’s CPU usage is 100MHz before rightsizing, removing vCPU’s will won’t change its CPU usage and it should still be at 100MHz. This means there is no reclaimable capacity associated with overallocation of vCPUs. Reclaimable CPU Usage for oversized VMs will always be 0 MHz.
Reclaimable Memory Consumed (GB): An oversized VM can have reclaimable memory only if consumed memory is greater than the new recommended size of the VM. The reclaimable memory capacity is the difference between consumed memory and recommended size.
Increased CPU Usage (GHz): CPU Usage of a VM of an undersized VM is expected to be the current CPU Demand. The difference between CPU Demand and CPU Usage is the expected increase in capacity utilized after rightsizing.
Increased Memory Consumed (GB): It can be expected for consumed memory to increase by the same amount of memory recommended to add to an undersized VM.
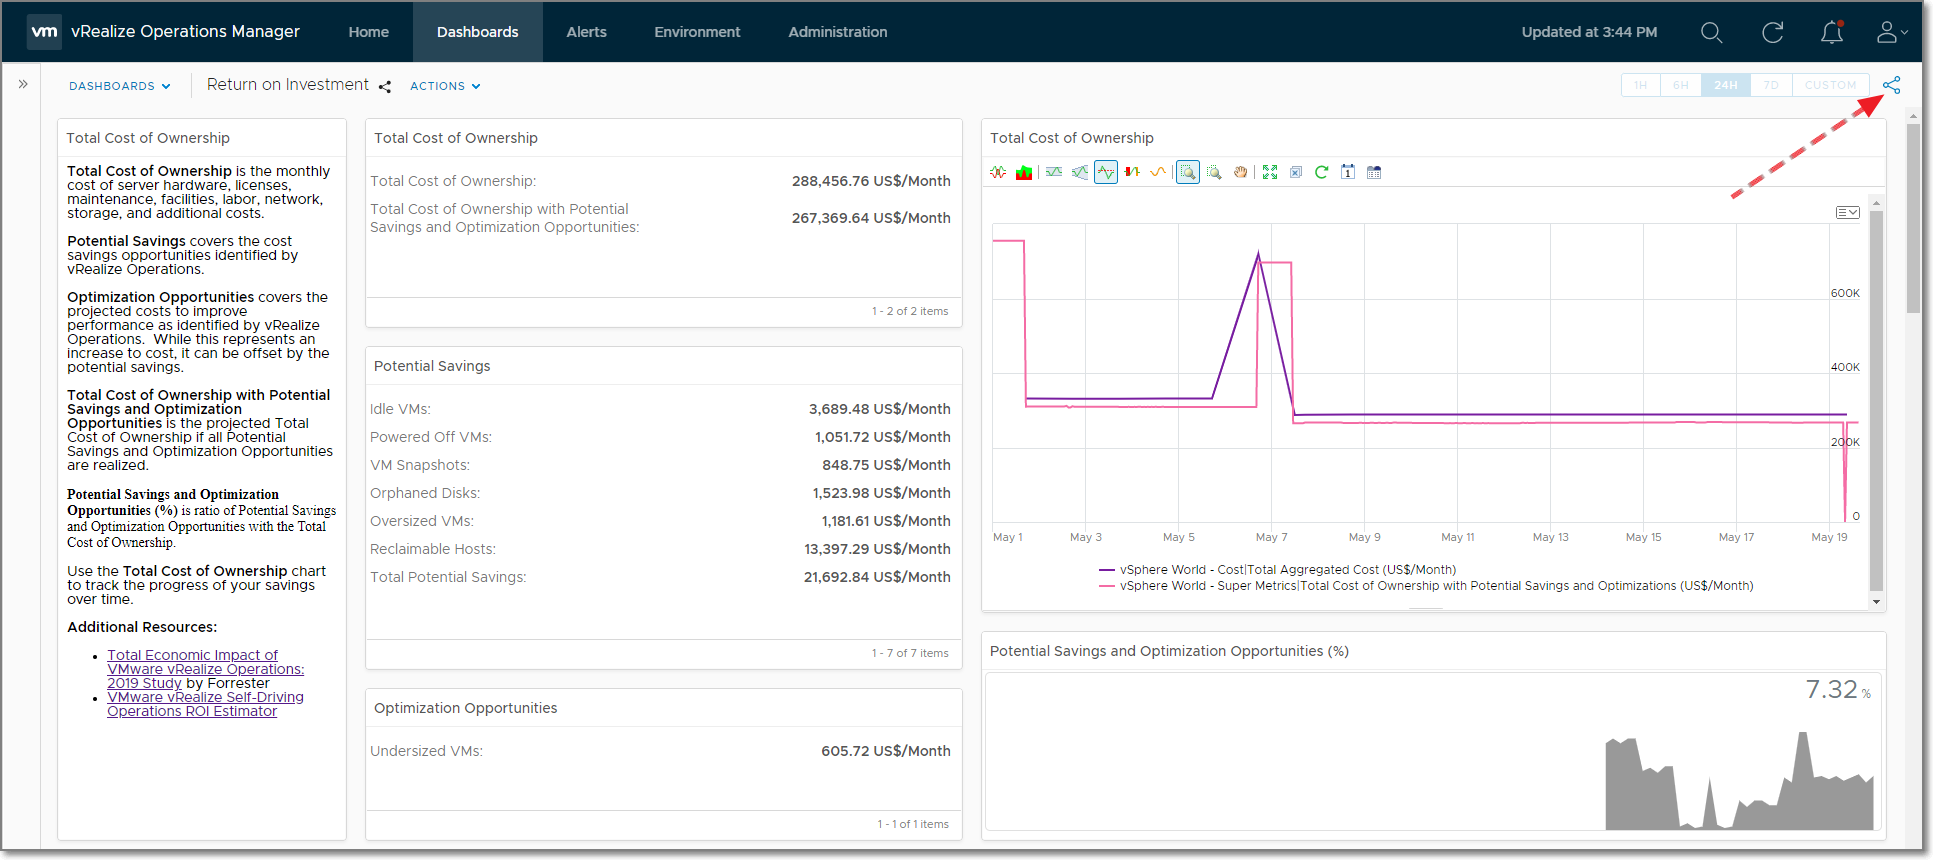
What is the potential change to VM cost if the VMs are rightsized?
The other question I get frequently is to quantify the potential cost impact due to rightsizing. Today, vRealize Operations does not calculate that cost, but they can be calculated using Super Metrics and the capacity Super Metrics from the previous section.
Calculating the potential cost can be utilization or allocation based, depending on whether allocation model enabled for capacity.
Potential Cost Savings Calculation Detail:
Oversized CPU Utilization: $0 since Reclaimable CPU Usage (GHz) is always 0
Oversized Memory Utilization: Reclaimable Memory Consumed (GB) * Cluster Memory Base Rate
Oversized CPU Allocation: vCPU(s) to Remove * Allocation Cluster CPU Base Rate
Oversized Memory Allocation: Memory to Remove * Allocation Cluster Memory Base Rate
Potential Cost Increase Calculation Detail:
Undersized CPU Utilization: Increased CPU Usage (GHz) * Cluster CPU Base Rate
Undersized Memory Utilization: Increased Memory Consumed (GB) * Cluster Memory Base Rate
Undersized CPU Allocation: vCPU(s) to Add * Allocation Cluster CPU Base Rate
Undersized Memory Allocation: Memory to Add * Allocation Cluster Memory Base Rate
Conclusion
Calculating the Recommended Size for VMs should be less of a mystery now. I hope this explanation of how Recommended Size is calculated helps earn your trust in the recommendations offered by vRealize Operations and helps empower you to have the rightsizing conversations with your VM and application owners. All of this in the name of achieving the best performance of your vSphere infrastructure and your VMs, reclaiming unused capacity, and quantifying cost savings.
If you’re not a vRealize Operations customer, why not download a trial of vRealize Operations and try it in your own environment?
You can find more demos and videos from our community at vrealize.vmware.com.
The post Rightsizing VMs with vRealize Operations appeared first on VMware Cloud Management.