I hope you enjoyed my last post around running production operations with out of the box dashboards with vRealize Operations Manager 6.6. While that post was focused on providing you a visibility into your environments, with this post we will drill down into the specific topic of Capacity Management in a Cloud Environment.
While I have worked with most of the roles within an IT organization, I believe the most trivial role is of person managing Capacity of a virtual environment. This role requires one to be on their feet at all the times to ensure they are able to get answers to complex problems that revolve around capacity managment. I tend to divide these complex problems into 5 simple categories:
1- How much Capacity do I have?
2- How is it being utilized?
3- How much Capacity is left?
4- When will I run out of Capacity?, and
5- When do I need to trigger the next purchase?
While the above questions sound simple, when you apply them to a Software Defined Datacenter, they become extremely complex. The complexity is primarily due to the fact that you are sharing physical resources using the hypervisor between multiple operating systems and applications riding on top of virtual machines. While the focus seems to be capacity, another major dimension which one needs to tak care of is Performance. The above mentioned role is also responsible for ensuring that all the virtual machines which are running in this environment are being Served Well. It is essential that the Capacity owner strikes a balance between Performance and Capacity which makes this problem harder to solve.
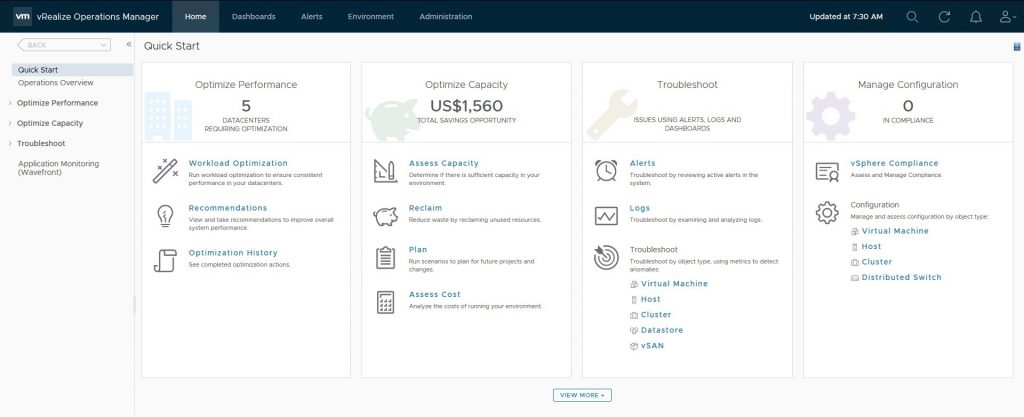
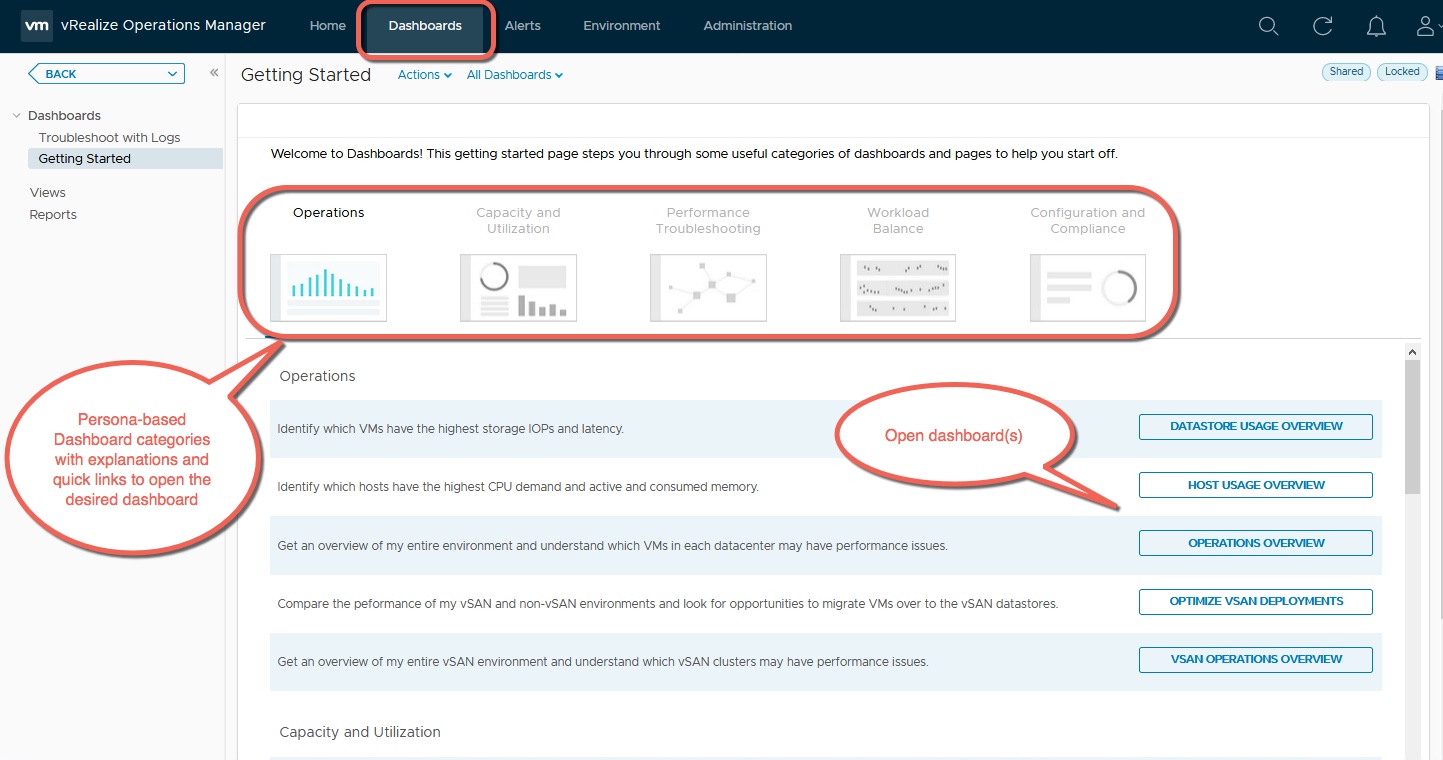
With vRealize Operations 6.6 we try to answer these questions with the use of out-of-the box dashboards. It was important that all this valuable IP was easily accessible through a centralized console which acts as an anchor for user of vRealize Operations Manager. In order to achieve this, we introuduced a “Getting Started” dashboard which would step you through some useful categories and use cases.
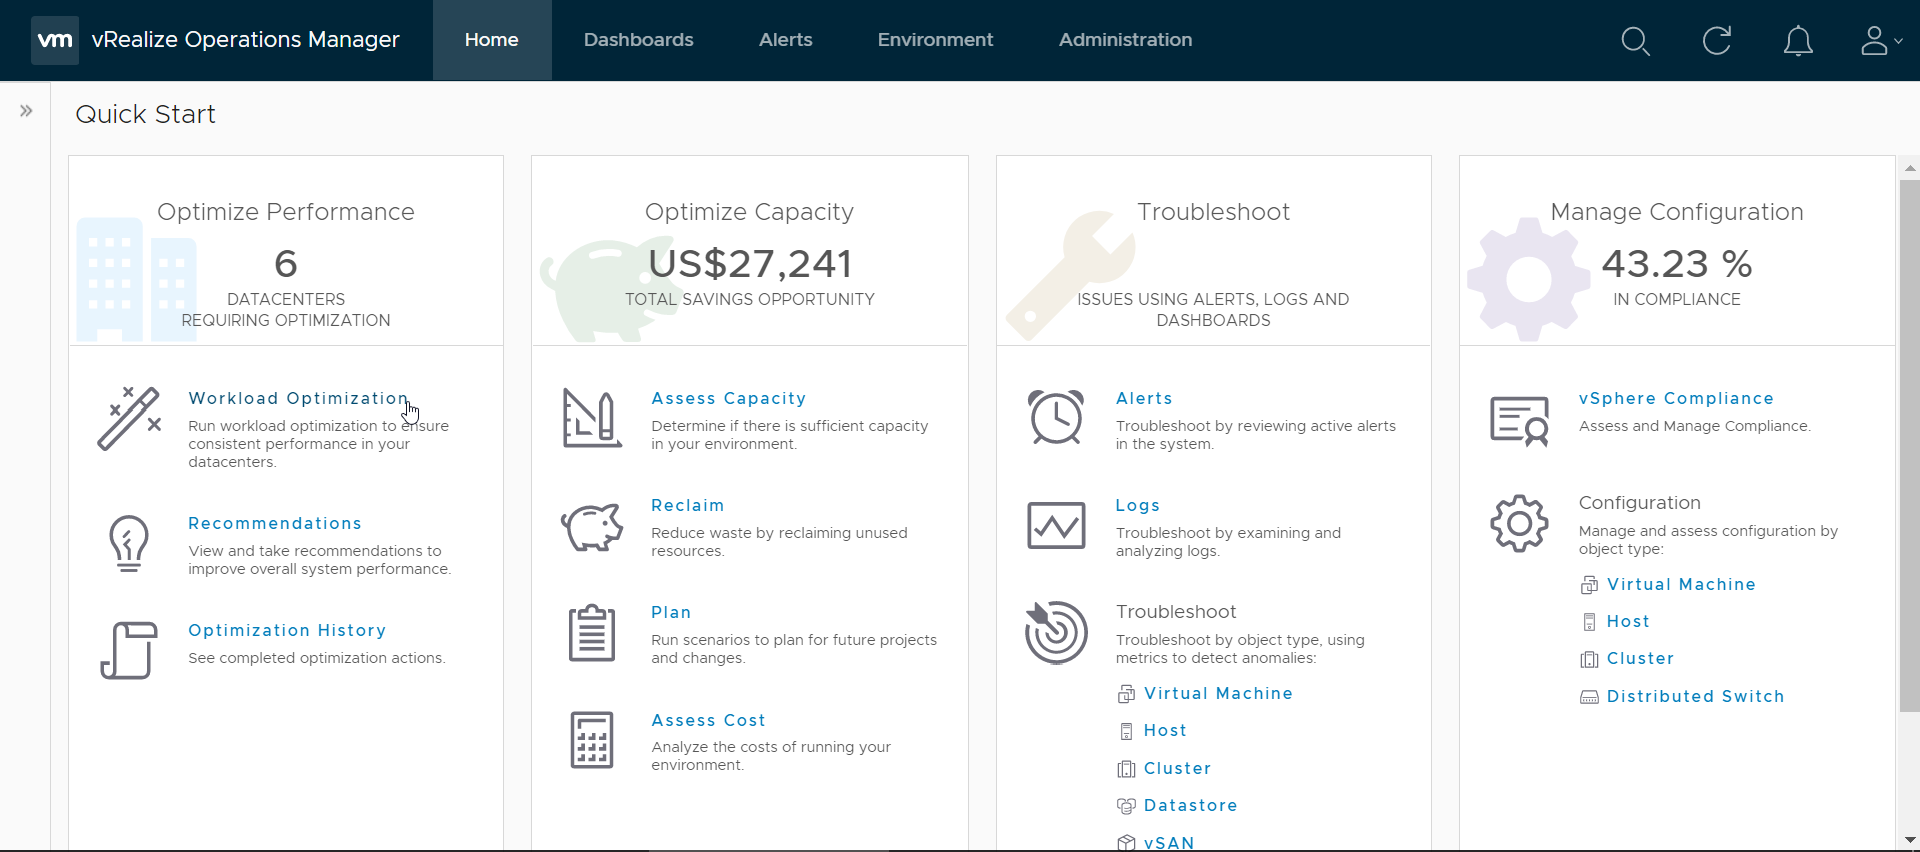
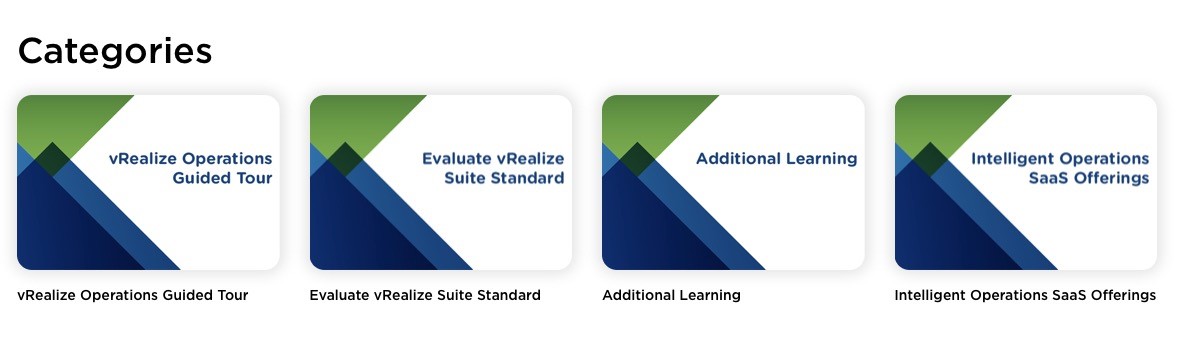
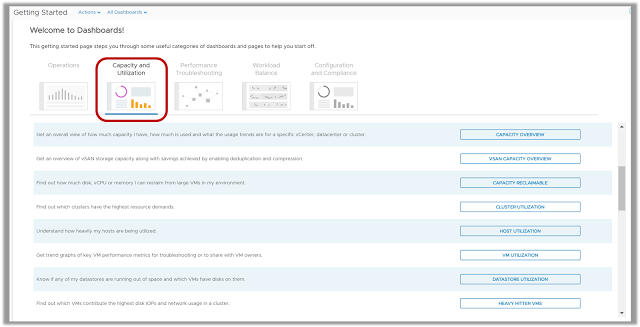
Today we will have a look at the second category which is called Capacity and Utilization. Here is how this category shows up on the Getting Started Page:
![]()
As mentioned before, Capacity and Utilization category caters to the teams responsible for tracking the utilization of the provisioned capacity in there virtual infrastructure. The dashboards within this category allow you to take capacity procurement decisions, reduce wastage through reclamation, and track usage trends to avoid performance problems due to capacity shortfalls.
Key questions these dashboards help you answer are :
- How much capacity I have, how much is used and what are the usage trends for a specific vCenter, datacenter or cluster?
- How much Disk, vCPU or Memory I can reclaim from large VMs in my environment to reduce wastage & improve performance?
- Which clusters have the highest resource demands?
- Which hosts are being heavily utilized and why?
- Which datastores are running out of disk space and who are the top consumers?
- How is the storage capacity & utilization of my vSAN environment along with savings achieved by enabling deduplication and compression?
Let us look at each of these dashboard and I will provide a summary of what these dashboards can do for you along with a quick view of the dashboard:
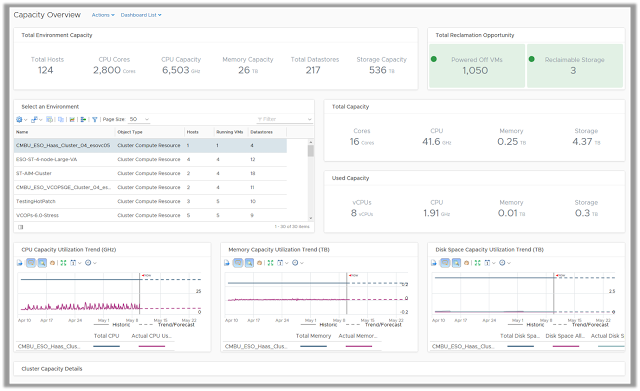
Capacity Overview
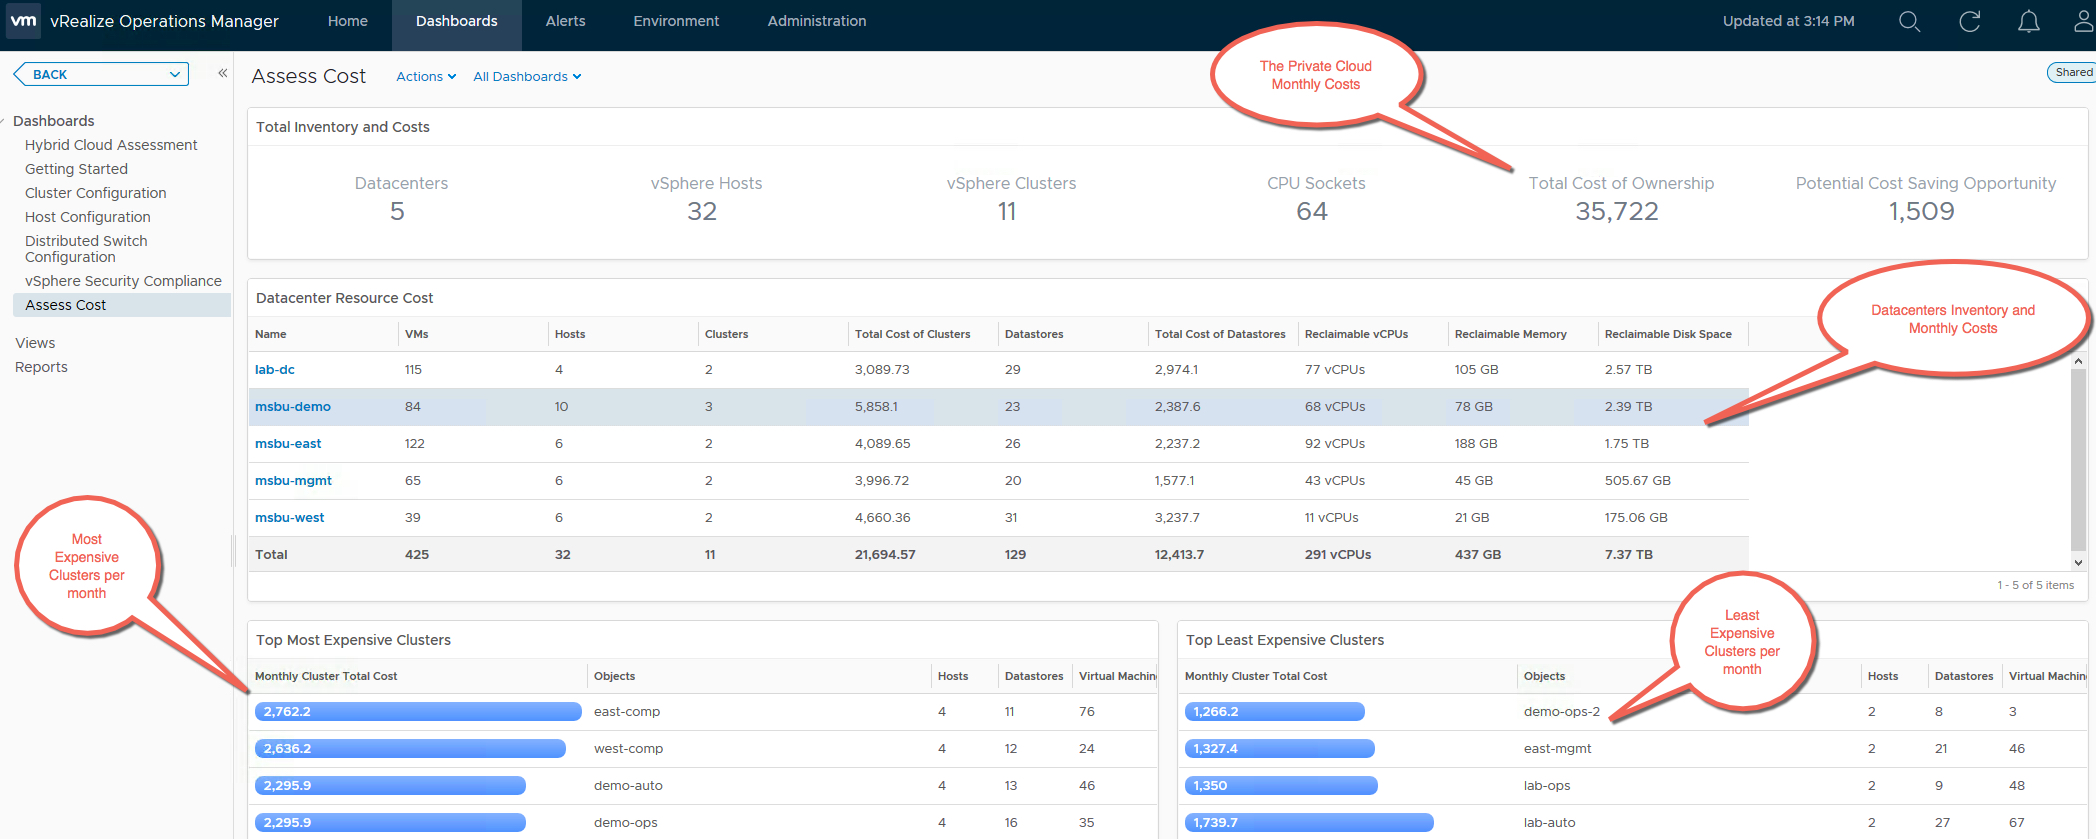
The Capacity Overview Dashboard provides you a summary of the total physical capacity available across all your environments being monitored by vRealize Operations Manager. The dashboard provides a summary of CPU, Memory and Storage Capacity provisioned along with the resource reclamation opportunities available in those environments.
Since capacity decisions are mostly tied to logical resource groups, this dashboard allow you to assess Capacity and Utilization at each resource group level such as vCenter, Datacenter, Custom Datacenter or vSphere Cluster. You can quickly select an object and view it’s total capacity and used capacity to understand the current capacity situation. Capacity planning requires you to have visibility into the historical trends and future forecasts, hence the trend views within the dashboard provide you this information to predict how soon you will run out of capacity.
If you plan to report the current capacity situation to others within your organization, you can simply expand the Cluster Capacity Details view on this dashboard and export this as a report for sharing purposes.
![]()
To see this dashboard in action click here
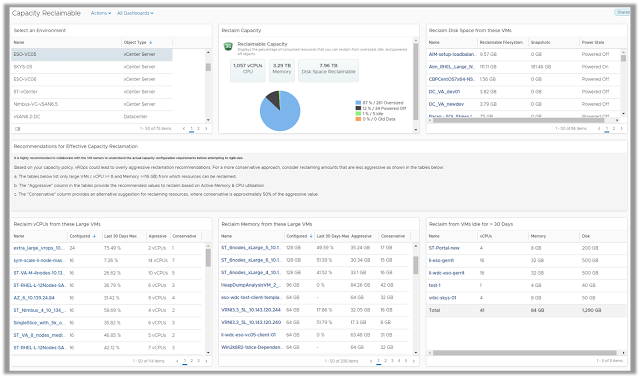
Capacity Reclaimable
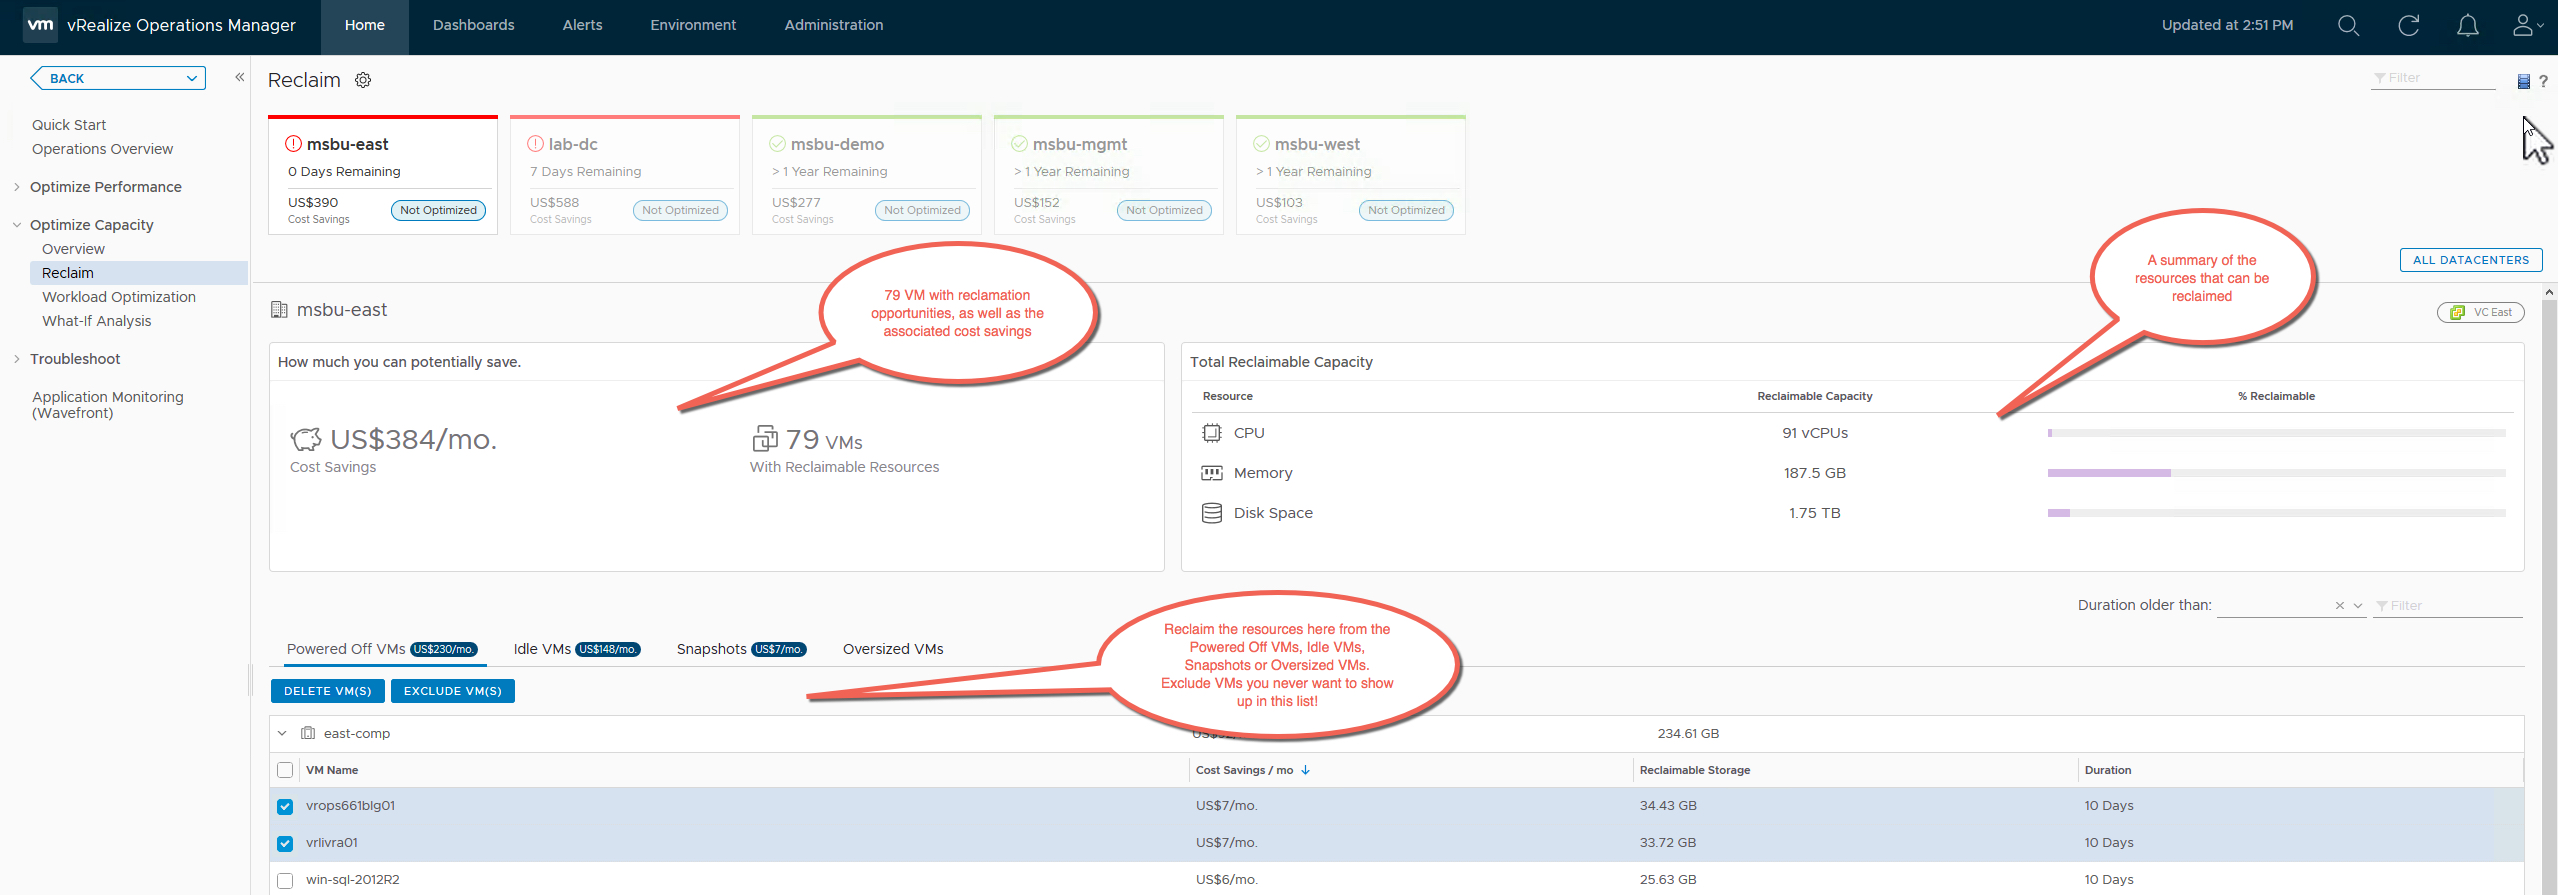
The Capacity Reclaimable Dashboard provides you a quick view of resource reclamation opportunities within your virtual infrastructure. This dashboard is focused on improving the efficiency of your environment by reducing the wastage of resources. While this wastage is usually caused by idle or powered off virtual machines another biggest contributor to this wastage is oversized virtual machines.
This dashboard allows you to select an environment and quickly view the amount of capacity which can be reclaimed from the environment in form of reclaimable CPU, Memory and Disk Space.
You can start with the view which lists down all the virtual machines running on old snapshots or are powered off. These VMs provide you the opportunity of reclaiming storage by deleting the old snapshots on them or by deleting the unwanted virtual machines. You can take these action right from this view by using the actions framework available within vRealize Operations Manager.
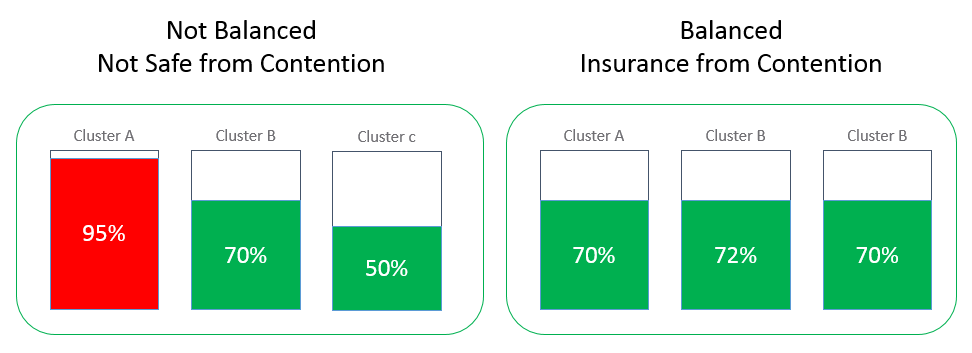
The dashboard provides you recommended best practices around reclaiming CPU and Memory from large virtual machines in your environment. Since large and oversized virtual machines can increase contention between VMs, you can use the phased approach of using aggressive or conservative reclamation techniques to right size your virtual machines.
![]()
To see this dashboard in action click here
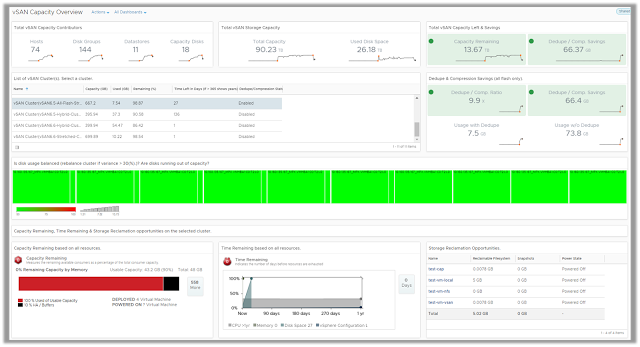
vSAN Capacity Overview
The vSAN Capacity Overview dashboard provides an overview of vSAN storage capacity along with savings achieved by enabling dedupe and compression across all your vSAN clusters.
The dashboard allows you to answer key questions around capacity management such as total provisioned capacity, current and historical utilization trends and future procurement requirements. You can view things like capacity remaining, time remaining and storage reclamation opportunities to take effective capacity management decisions.
The dashboard also focuses on how vSAN is using the disk capacity by showing you a distribution of utilization amongst vSAN disks. You can view these details either as an aggregate or at individual cluster level.
![]()
To see this dashboard in action click here
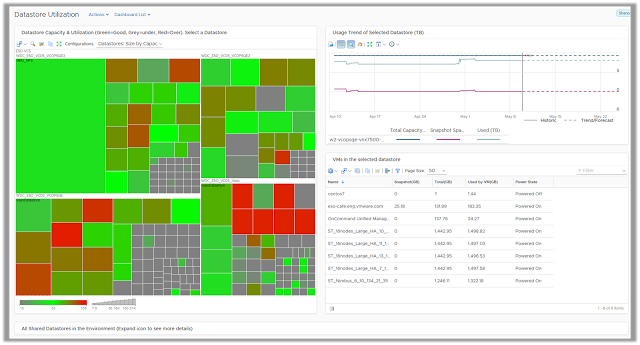
Datastore Utilization
The Datastore Utilization dashboard is a quick and easy way to identify storage provisioning and utilization patterns in a virtual infrastructure. It is a best practice to have standard datastore sizes to ensure you can easily manage storage in your virtual environments. The heatmap on this dashboard plots each and every datastore monitored by vRealize Operations Manager and groups them by clusters.
The utilization pattern of these datastores is depicted by colors, where grey represent an underutilized datastore, red represents a datastore running out of disk space and green represents an optimally used datastore.
By selecting a datastore, you can see the past utilization trend and forecasted usage. The view within the dashboard will list all the virtual machines running on the selected datastore and provide you with the opportunity to reclaim storage used by large virtual machines snapshots or powered off VMs.
You can use the vRealize Operations Manager action framework to quickly reclaim resources by deleting the snapshots or unwanted powered off VMs.
![]()
To see this dashboard in action click here
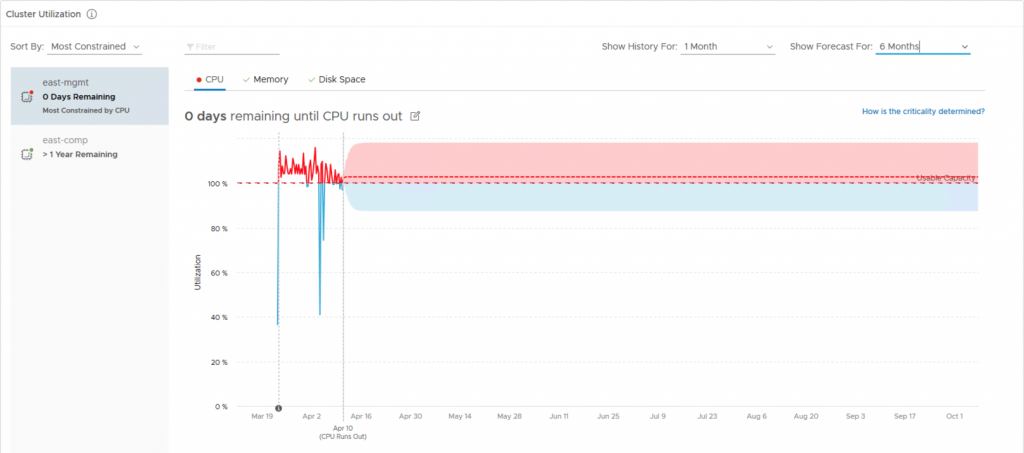
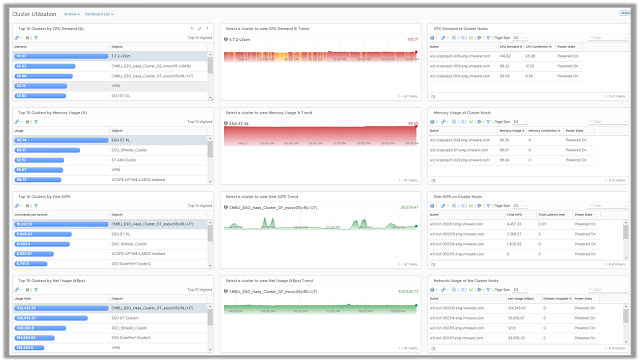
Cluster Utilization
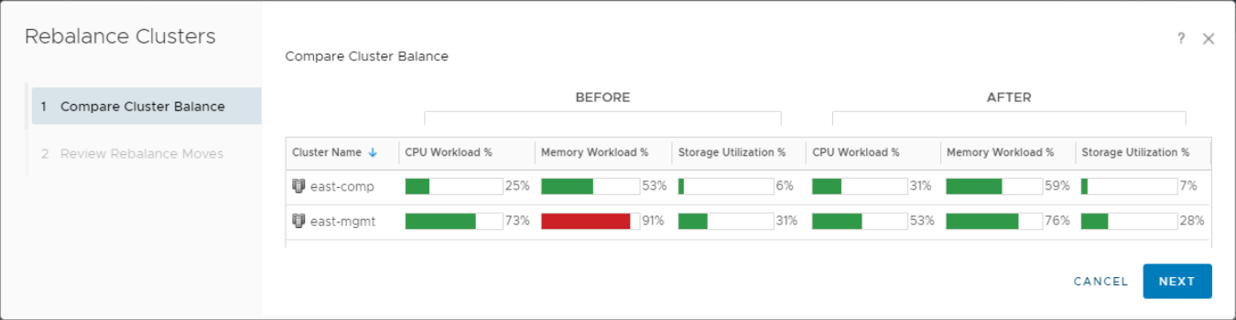
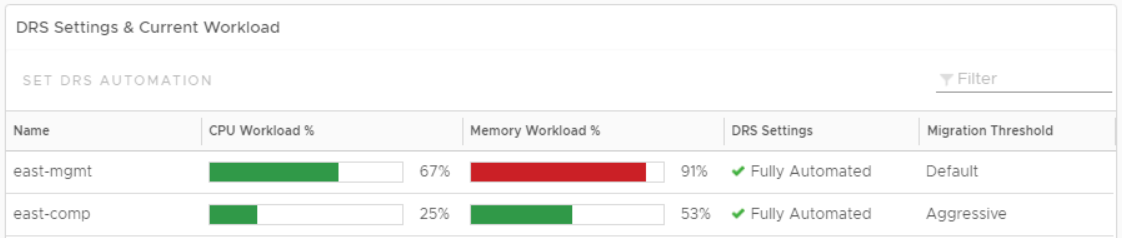
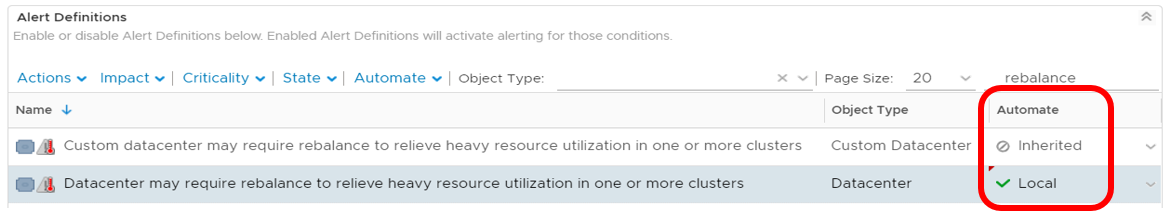
The Cluster Utilization dashboard allows you to identify the vSphere clusters that are being heavily consumed from a CPU, memory, disk, and network perspective. High or unexpected resource usage on clusters may result in performance bottlenecks. Using this dashboard you can quickly identify the clusters which are struggling to keep up with the virtual machine demand.
On selecting a cluster with high CPU, Memory, Disk or Network demand, the dashboard provides you with the list of ESXi hosts that are participating in the given cluster. If you notice imbalance between how the hosts within the selected clusters are being used, you might have an opportunity to balance the hosts by moving virtual machines within the cluster.
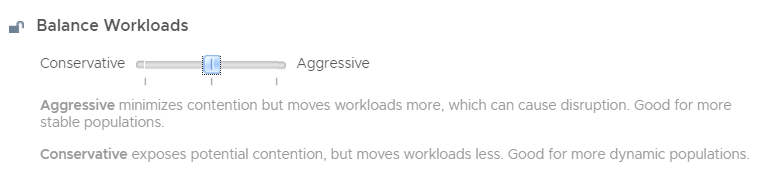
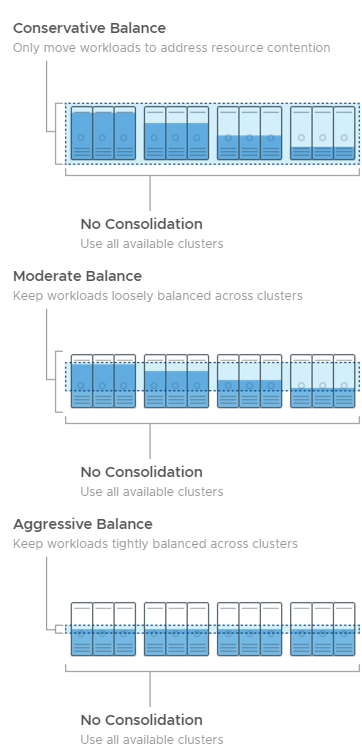
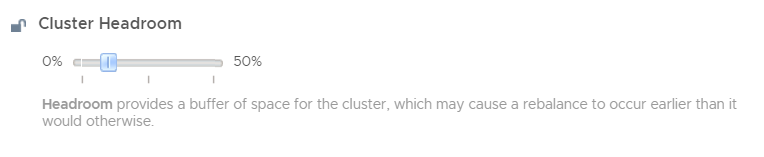
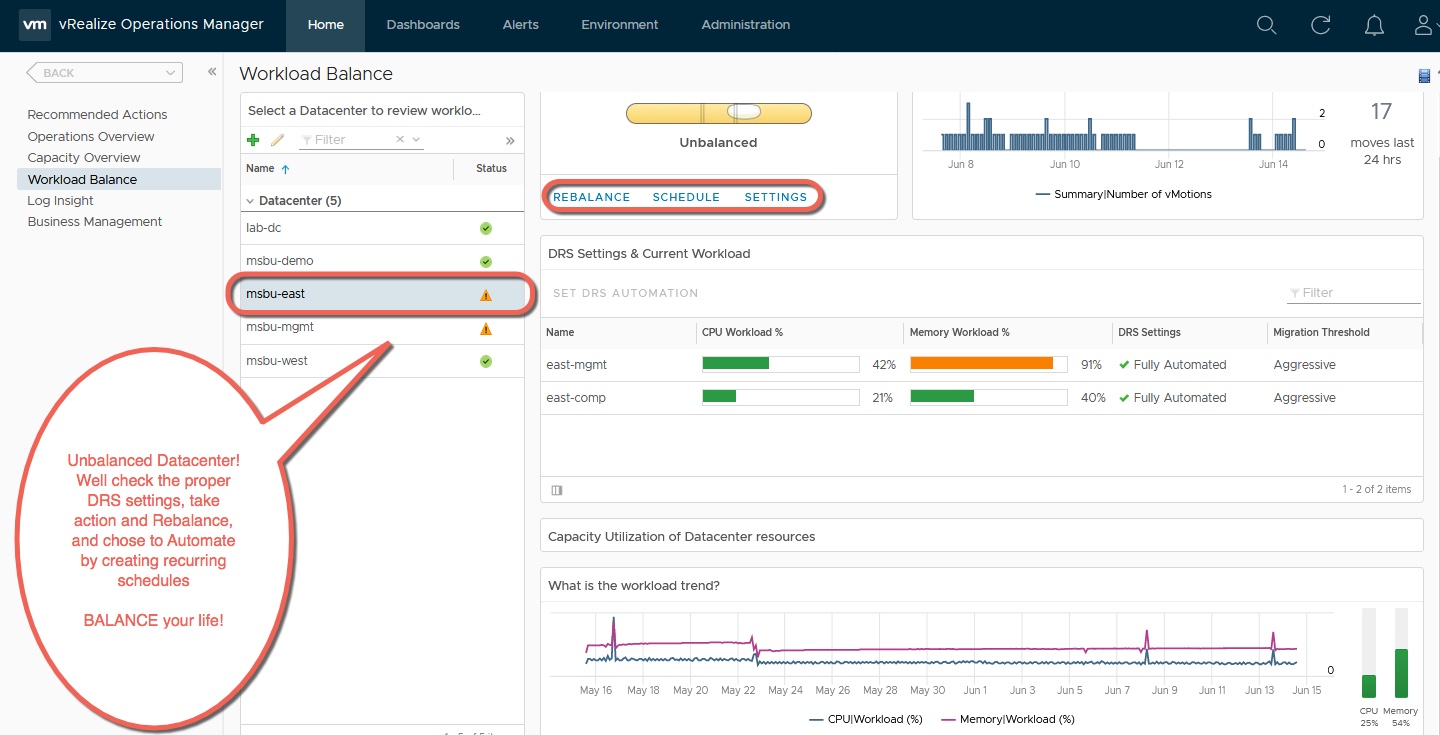
In situations where the cluster demand has been historically chronic virtual machines should be moved out of these clusters to avoid potential performance issues using Workload Balance. If such patterns are observed on all the clusters in a given environment, it indicates that new capacity might be required to cater to the increase in demand.
![]()
To see this dashboard in action click here
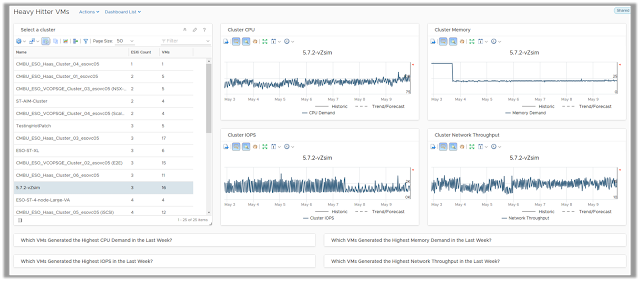
Heavy Hitter VMs
The Heavy Hitter VMs dashboard helps you identify virtual machines which are consistently consuming high amount of resources from your virtual infrastructure. In heavily overprovisioned environments, this might create resource bottlenecks resulting in potential performance issues.
With the use of this dashboard you can easily identify the resource utilization trends of each of your vSphere clusters. Along with the utilization trends, you are also provided with a list of Virtual Machines within those clusters based on their resource demands from CPU, Memory, Disk and Network within your environment. The views also analyze the workload pattern of these VMs over the past week to identify heavy hitter VMs which might be running a sustained heavy workload (measured over a day), or bursty workloads (measure using peak demand).
You can export the list of offenders using these views and take appropriate actions to distribute this demand and reduce potential bottlenecks.
![]()
To see this dashboard in action click here
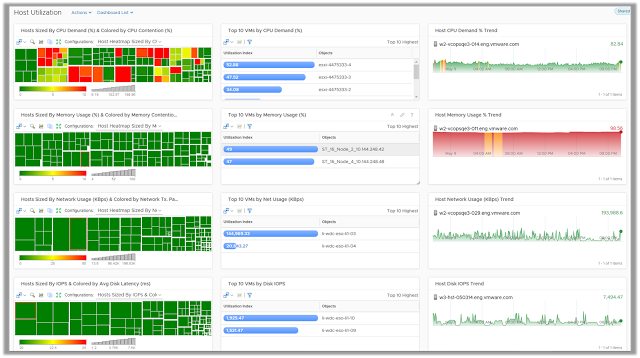
Host Utilization
The Host Utilization dashboard allows you to identify the hosts that are being heavily consumed from a CPU, memory, disk, and network perspective. High or unexpected resource usage on hosts may result in performance bottlenecks. Using this dashboard you can quickly identify the hosts which are struggling to keep up with the virtual machine demand. The dashboard also provides you with the list of top 10 virtual machines to easily identify the source of this unexpected demand and take appropriate actions.
Since the demand of resources fluctuates over a period of time, the dashboard allows you to look at demand patterns over the last 24 hours to identify hosts which might have a chronic history of high demand. If such cases virtual machines should be moved out of these hosts to avoid potential performance issues. If such patterns are observed on all the hosts of a given cluster, it indicates that new capacity might be required to cater to the increase in demand.
![]()
To see this dashboard in action click here
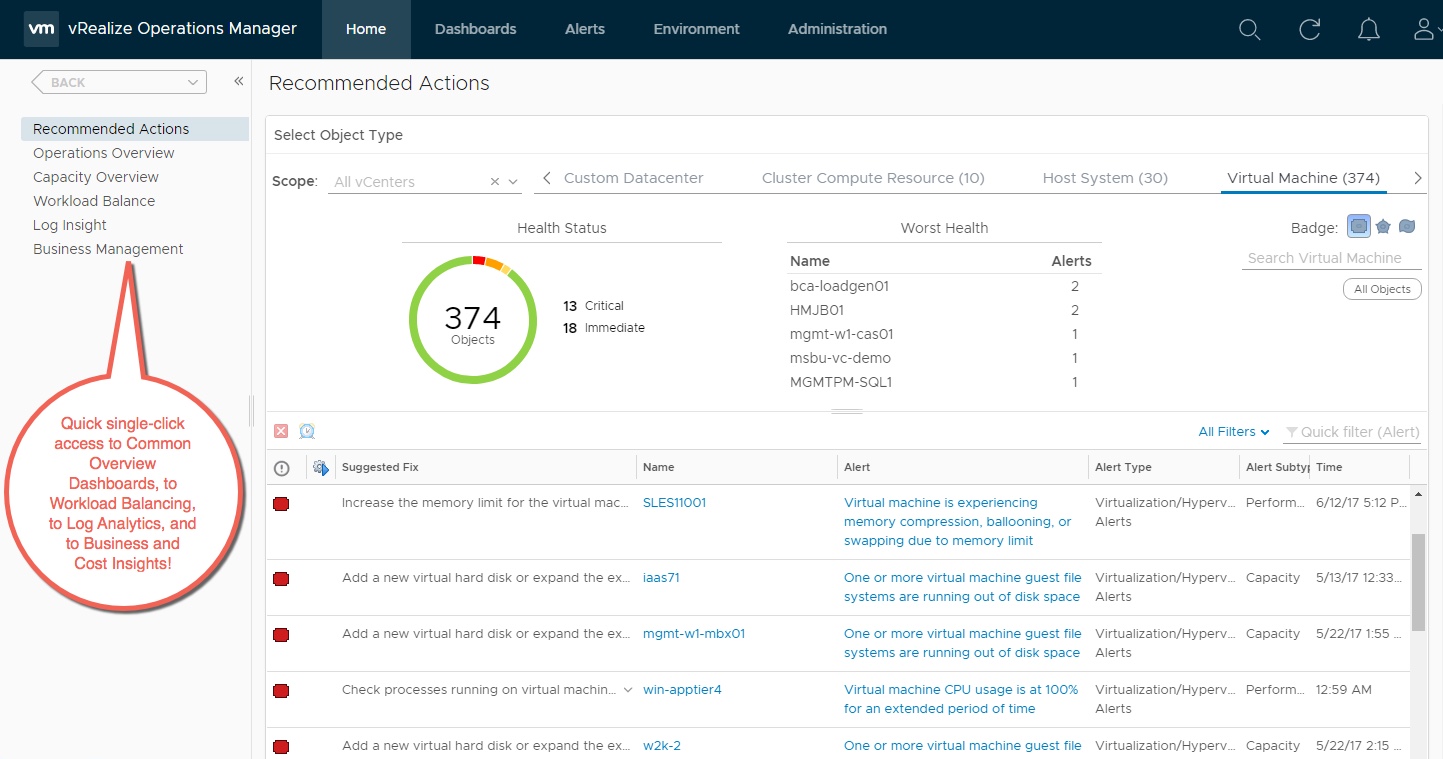
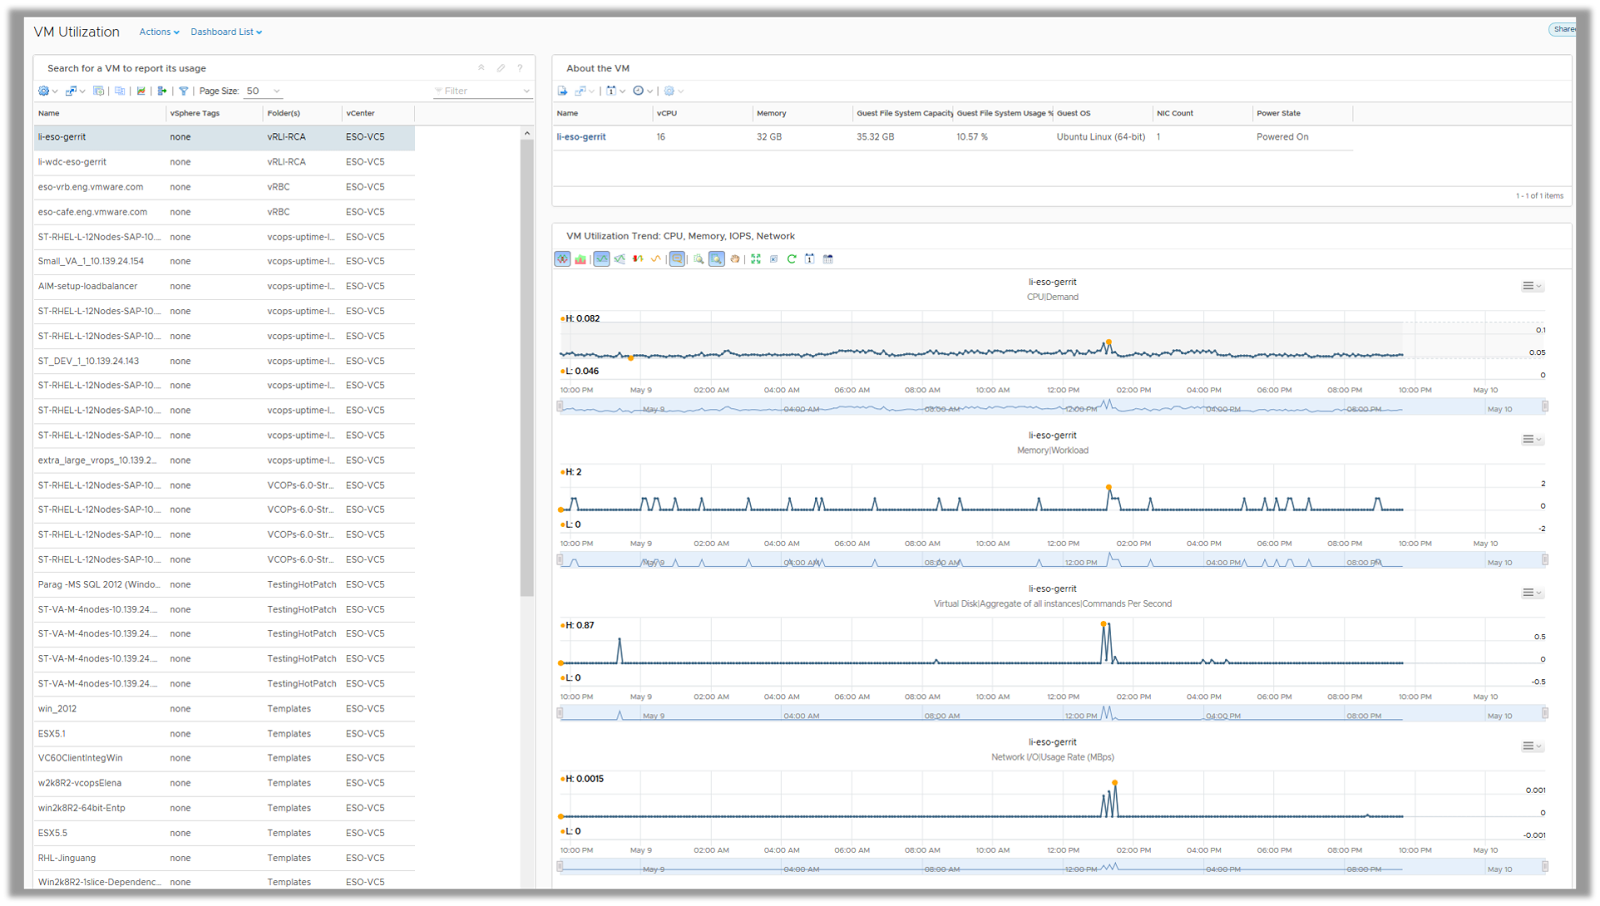
VM Utilization
The VM Utilization Dashboard helps the VI Administrator to capture the utilization trends of any virtual machine in their environment. The primary use case is to list down the key properties of a virtual machine and the resource utilization trends for a specific time period and share the same with the VM/Application owners.
The VM/Application owners often want to look at the resource utilization trends at specific time periods where they are expecting high load on applications. Activities like, batch jobs, backup schedules, load testing etc. could be a few examples. The application owners want to ensure that VMs are not consuming 100% of the provisioned resources during these periods as that could lead to resource contention within applications causing performance issues.
![]()
To see this dashboard in action click here
Hope this post will give you insights on how each of these dashboards can help you manage capacity and performance and ensure that you have answer to those difficult questions at the back of you hand. Stay tuned for more information on other categories.
The post Manage Capacity and Utilization with vRealize Operations 6.6 Dashboards appeared first on VMware Cloud Management.
 VMware


 There’s an old joke that IT is about keeping the lights on. Have you ventured into The Home Depot lately? Lighting isn’t what it used to be! With a diversity of choices—LED, CFL, Halogen, Fluorescent and, for now, the old incandescent bulb Thomas Edison would recognize, the simplicity of yesteryear is gone. The same could be said for the data center, only in our industry, it’s yesterday—or even yesterminute!