Quantcast
Channel: vCenter Operations – VMware Cloud Management
Viewing all 242 articles
Browse latest View live

Moving VMs is not solving your SDDC Management Problems!

$
0
0

In my last blog article, “What is Intelligent Operations Management in the SDDC” , I discussed how intelligent operations management of the Software Defined Data Center (SDDC) can be broken down into three (3) areas of focus: Topology Scope, Data Collection and Management Functions.  We also talked about what each of these areas brings to […]

The post Moving VMs is not solving your SDDC Management Problems! appeared first on VMware Cloud Management.


Getting More Out of vRealize Operations 6.x: Full Stack Application Monitoring

Getting More Out of VMware: Distributed Resource Management

$
0
0

On June 8th, we will be hosting a Getting More Out of VMware webinar about Distributed Resource Management using Dynamic Resource Scheduler (DRS) and vRealize Operations (vR Ops). In this session, we will examine how to combine DRS and vRealize Operations Manager capabilities to deliver the most efficient compute platform for your virtual machines.  We […]

The post Getting More Out of VMware: Distributed Resource Management appeared first on VMware Cloud Management.

Getting More Out of VMware: vRealize Operations for Horizon

$
0
0

On June 22nd, we will be hosting a Getting More Out of VMware webinar on How to Operationalize vRealize Operations for Horizon. In this session, we will demonstrate how to leverage vRealize Operations for Horizon to quickly take control of performance issues impacting End-user experience in your Horizon View environment.  We will provide a deeper […]

The post Getting More Out of VMware: vRealize Operations for Horizon appeared first on VMware Cloud Management.

Getting More Out of vRealize Operations: Day 2/3 Operations

$
0
0

By: Ryan Cartwright, VMware Senior Systems Engineer & David Kruse, VMware Staff Systems Engineer

Getting More Out of vRealize Operations webinar series is kicking off the 3rd Quarter 2016 with a session called Day 2/3 Operations on July 13th, 2016. Best practices on what you can achieve on Day 3 will be discussed after you have deployed vRealize Operations (vROps) and are collecting from at least one vCenter data source. In Q1 2016, David Kruse demonstrated best practices in what you can accomplish on Day 2. Please review this blog and webinar for details.

In Day 3, the primary focus is monitoring the Application. This session will demonstrate how to build the container object and all the objects supporting the application – dashboards, views, reports, super metrics, metric configurations, and alerts that will manage the application. A few weeks ago, John Dias delivered a session called Full Stack Application Monitoring on May 25th, 2016. This was an excellent session that demonstrated the full power of using vROps as a comprehensive management platform for managing the application. This session will dive into the finished product that John presented and get you started on how you can bring this same value into your organization using vROps. If you were not able to catch John’s Getting More out of… session, I highly recommend you check it out.

Let’s take a look at what will be covered in the Day 2/3 Operations session.

Build and Create Application and Application Tier Groups

Building and creating the Application and Tier objects that will represent the Application that you are modeling and would like to manage. Don’t worry, you can start slow, and gradually build up the layers to the application stack. This webinar will show you both the preferred method, using dynamic groups, as well as the legacy method which is still supported today, Application and Tier objects.  Both are effective, but with the preferred method giving you the ability to have your container objects auto populate. In the below example, dynamic groups are built for the WOPR Application along with its Web, App and DB tiers.

GMODay3_Image1Populate Groups

We will need to populate the Tier groups with more object types other than Virtual Machines. So for this demonstration, Windows and Linux OS object types will be added. In Step 6 of the Day 2 Operations webinar, End-Point Operations (EPOps) is discussed. This is an agent based technology that will collect OS and Application metrics and send this data directly to vROps.

Create the Dashboard

Next, a dashboard will be created to manage the WOPR application. You will see that we need to create some super metrics to get the desired results.

Getting More Out OfCreate Super Metrics

As you can see in the dashboard, there are metrics being calculated for the Application object, the Web Tier, and DB Tier objects. These are derived metrics that are created with vROps super metrics, then applied to the correct object type.

GMODay3_Image3Create a Log Insight Content Pack

So how did John Dias create that custom Dashboard with Log Insight within vROps? That was pretty cool, and very valuable for troubleshooting. In this demo, you will see how to add a Log Insight Dashboard within vROps using the text widget. We’ll also talk about how to create a Log Insight Content Pack for your Application.

GMODay3_Image4Alerts and Symptoms

Understanding how Alerting and Symptoms work for Applications and their corresponding Tier objects is a very import topic. A basic understanding of the Group Object alert and how it can be modified will be illustrated. As usual, best practice is never to modify anything out of the box, but to clone this object first.

GMODay3_Image5Create Notifications

In Day 2, we discussed outbound rules for sending alerts. In this session, we will discuss Notifications. It’s important that the right people receive the right alerts, at the right time.

GMODay3_Image6Create a Maintenance Schedule

Every application, as minimal as it maybe, will have downtime for maintenance. Hardware/Software updates sometimes will cause application unavailability. During these maintenance windows, administrators and application owners do not want to get bombarded with alerts.  This session will demonstrate how to create a Maintenance Schedule, and how to apply it. (Hint: Policies)

Join us on July 13th, where we will be answering your questions live about Day 2/3 Operations. This webinar will be a valuable use of your time.

Click here to Register!

Visit www.vmware.com/go/getmore to view the entire Getting More Out of VMware webinar series.

The post Getting More Out of vRealize Operations: Day 2/3 Operations appeared first on VMware Cloud Management.

Cloud Solutions for Your Data Center – Today, 2016 Cloud Megacast You Can’t Miss!

$
0
0

Cloud Solutions for Your Data Center – Today, 2016 Cloud Megacast that You Can’t Miss!

VMware will be presenting Intelligent Operations cloud solutions for you to manage efficiently your data center, engage with cloud experts and learn performance and cloud solutions to some of the most complex environments.  Join the 2016 Cloud Megacast to be held on July 27 at 12PM EST. To register for free, click here. (Live and recorded)


WHY YOU NEED TO ATTEND THIS CLOUD-FOCUSED MEGACAST EVENT

  • Discover the various ways that “cloud” is impacting your data center and your IT function
  • Learn how VMware and six different companies from across the IT spectrum are helping their customers leverage the many potential benefits of cloud
  • See how each vendor adds cloud-based value to simplify IT deployment, performance & management
  • Get answers to your most burning cloud questions from the top experts in the community

MEGACAST EVENT BACKGROUND

“The cloud” is a term that has been hijacked, twisted about, and regurgitated by many marketers with nary a thought to what it actually happening under the hood. Part of the problem is that cloud is an umbrella term for a bunch of different possibilities, but it’s too often equated with only large public cloud services.

Here’s the thing: with all of the nuance in various discrete cloud services and with each of these having different sets of pros and cons, it can get really, really confusing when you’re looking at yet more products being marketed under the cloud moniker. You need to understand the options you have at your disposal and understand how to differentiate them so that you can properly categorize new products as they come on the market.

What if you could learn about the various cloud models and also gain insight into some of the leading products in each of those models? That’s exactly what you’ll get with the 2016 Cloud MegaCast. This is your unique opportunity to educate yourself about what’s happening in across the cloud spectrum and to discover solutions to some of your most complex data center issues. Learn from VMware how we’re driving positive outcomes for our customers.


cloud solutions, 2016 Cloud Megacast

The post Cloud Solutions for Your Data Center – Today, 2016 Cloud Megacast You Can’t Miss! appeared first on VMware Cloud Management.

Getting More Out of VMware – LIVE workshops at VMworld

$
0
0

Are you having trouble deciding how to spend your Sunday in Las Vegas? Before the frenzy of VMworld kicks in, VMware’s Cloud and Systems Engineering teams are hosting two Getting More Out of vRealize Operations workshops on Sunday, August 28th, to share best practices for utilizing vRealize Operations. Topics covered include capacity planning, resource optimization, performance troubleshooting, and application monitoring. Real-world use cases will be the basis for discussions and demonstrations so vRealize Operations customers should register to gain practical insights to take back to their environment.

191234-BANNER-GMO-990x150-101-72dpi-RGB

Key to operations management is finding the delicate balance between end user demands and the associated costs to the business. While excess capacity might keep users happy, it’s likely to make IT leadership not satisfied which may lead to other projects being cut from the budget. Let’s stop hoarding those unnecessary resources and start to clean up your environment. Let’s give leadership a reason to let us work on those new and innovative projects. They can be self-funded with the savings from our idle and powered off Virtual Machines sitting on expensive storage to those expensive database licenses for databases that haven’t been touched in years.

What’s Covered in these Getting More Out of VMware workshops?

In these workshops, we’ll help you to better understand your existing resource capacity and identify your primary consumers.  We’ll demonstrate how vRealize Operations can provide valuable insight into overall utilization and trending to ensure you always have the required resources available to meet demand, while operating as cost-effectively as possible. Alerts and automated actions can be used to manage demand more predictably and still adhere to organizational policies, standards and regulatory requirements.

These workshops combine the best of several subjects from our popular Getting More Out of VMware webcast series—including Optimize Your Existing Capacity, Automated Actions, Load Balancing, and Workload Placement and vRealize Operations: Symptoms, Alerts, Recommendations and Actions—into three hours of interactive discussion and demonstrations.

All of our existing content can be found on our portal which is available for free 24 hours a day 7 days a week!

vmworld-2016-hero-US_950

Join us!

Let’s start your 2016 VMworld experience in Las Vegas by interacting live with your favorite Getting More Out of presenters. Join us inside and avoid the heat!

Wake up early for our morning session from 8:30am – 11:30am, then cool off and enjoy the pool in the afternoon. Or, sleep in, and attend our afternoon session from 1:30pm – 4:30pm. We’ll be at the Luxor Hotel in Egyptian Room E-F.

This is a great opportunity to learn, interact with your peers and ask all your burning questions about vRealize Operations. Space is limited so register today!

The post Getting More Out of VMware – LIVE workshops at VMworld appeared first on VMware Cloud Management.

Monitoring vCenter Health Remotely with vRealize Operations – Part 3

$
0
0

By: Greg Hohertz, Blue Medora


In Part 1 and Part 2 of this blog, I discussed how you can monitor vCenter’s databases remotely using Blue Medora’s Management Pack for PostgreSQL and Microsoft SQL. Monitoring database performance is important to understanding the performance and health of your vCenter server, but it is just as import to understand the performance and health of the vCenter server itself. In this blog, we’ll take a look at vCenter specific metrics, best practices, and how you can monitor these with vRealize Operations Manager.

First, it is important to understand the best practices and to identify which performance metrics really matter when monitoring vCenter.  For this, we will take a look at VMware’s Technical White Paper “VMware vCenter Server Performance and Best Practices.” This white paper addresses key performance indicators for vCenter health and performance, as well as capacity metrics to watch. We see that CPU, Memory, Disk I/O, Network Throughput, Network I/O, and Concurrency (number of vCenter operations run currently) are the key indicators for performance and capacity.

Screen Shot 2016-07-31 at 5.20.18 PM

Figure 1: Monitoring vCenter Dashboard


Luckily, vRealize Operations provides most of the key metrics we need to monitor. Additionally, we can leverage vRealize Operations’ analytics to understand both the capacity and stress of our vCenter server. After selecting your vCenter server on this custom dashboard, a number of key widgets will give you insights into your vCenter server performance and capacity.

Screen Shot 2016-07-31 at 5.51.50 PM

Figure 2: Health, Capacity, Stress


Down the left-hand column we have three indicators:

  1. 6-hour historical health of the vCenter server: showing the calculated overall health of your vCenter server for the last six hours
  2. Capacity remaining widget: showing your capacity remaining based on the most constrained resource
  3. Stress widget: showing the demand against vCenter capacity over time


Screen Shot 2016-08-15 at 3.08.12 PM

Figure 3: Alerts, Key Performance Indicators, and Inventory


Down the right column we have three widgets that display open alerts on the vCenter server, key performance indicators, and an inventory of resources managed by your vCenter server. Under Key Performance Indicators, CPU, Memory, Network Operations and Throughput are all displayed along with a 6-hour sparkline showing the historical values of these metrics. Next is an inventory of Virtual Machines and Hosts (both totals and online) as well as total Clusters managed by this vCenter instance.

By combining remote database monitoring using the Blue Medora database management packs and the out-of-the-box monitoring provided for the vCenter instance, we now have some insight into the performance and capacity of our vCenter server. Next step is to set up some symptoms and alerts to notify us when anomalies occur relative to capacity or performance.

The post Monitoring vCenter Health Remotely with vRealize Operations – Part 3 appeared first on VMware Cloud Management.


Extend vRealize Operations further through Blue Medora True Visibility Suite Management Pack bundles

$
0
0

VMware and Blue Medora are announcing the launch of the Blue Medora True Visibility Suite (TVS) Management Packs bundles for vRealize Operations to be available on September 1st, 2016 in Standard, Advanced, Enterprise, and Management Connectors editions.


Data Center infrastructure and virtualization operations management just got progressively better with a new and greatly enhanced offering from VMware and Blue Medora with the introduction of the Blue Medora TVS for vRealize Operations, management pack bundles. Blue Medora TVS extends VMware vRealize Operations to the broader heterogeneous data center and multi-cloud environments to give our users true analytical and enterprise-wide unified visibility.


These bundles offer a convenient, applicable, and flexible way for vRealize Operations customers to extend operations management, monitoring, and analytics far beyond vSphere to include multi-vendor infrastructure and applications. These extensions include servers, storage, networking, databases, and applications. Customers now have the option of picking the True Visibility Suite most applicable to their needs, and can use any or all of the management packs within the suite, without requiring individual licenses, or line item SKU’s to purchase. These options include the following:

  • Standard: includes multi-vendor compute and EMC storage
  • Advanced: includes multi-vendor compute, storage, networking, converged systems and other hypervisors
  • Enterprise: includes everything in Advanced plus connectors to other management tools and enterprise applications, databases and middleware
  • Management Connectors: Covering the importing of monitored and collected data from leading third party data center operations tools
vRealize Operations - Blue Medora True Visibility Suite (TVS) editions

The TVS bundles include the complete Blue Medora inventory of management packs. There are more than 30 such management packs in various bundles. All the Blue Medora TVS for vRealize Operations management pack bundles can be found on VMware’s Cloud Management Solution Exchange page.

VMware Solution Exchange BM TVS 1 VMware Solution Exchange BM TVS 2


Check out our new video recapping the Blue Medora True Visibility Suite for VMware vRealize Operations.

For more information:

The post Extend vRealize Operations further through Blue Medora True Visibility Suite Management Pack bundles appeared first on VMware Cloud Management.

vRealize Operations Manager – Monitoring vs Forensic

$
0
0
Purpose

Did you ever wonder or faced the following questions from a customer regarding vRealize Operations Manager?

  • Why the resource utilization metrics shown by OS and other monitoring tools does not match with those shown in vRealize Operations Manager?
  • Why vRealize Operations Manager shows so many parameters and is complex to look at?
  • Why the reclamation suggestions provided by vRealize Operations Manager does not align with other tools?
  • Why only badges are shown instead of utilization in vRealize Automation when you integrate it with vRealize Operations Manager?

If your answer is yes to any of the above, then this blog is for you.

Before I go ahead and discuss the above questions, let’s cover some basics first.

What is Monitoring?

Monitoring can be defined as observing the current behavior of any system to make sure that it runs as expected or well within the defined boundaries. We use this method in our everyday life in all possible areas. For this discussion, I am confining myself to only Datacenter monitoring and more specifically to Virtualized Datacenter.

From Datacenter perspective, monitoring means the process of using manual or automated tools and techniques to continuously observe the different components of Datacenter to make sure that the health of every one of them is in compliance with defined criteria’s.

Traditionally from Datacenter perspective we majorly monitor the following components:

  • Physical Hardware (Server)
  • Network
  • Operating System and Applications
  • Security

In every datacenter we typically have Network Operations Center (NOC) and Security Operations Center (SOC) where we monitor network and security operations of an Organization. Traditionally we have a live display or Dashboard where we project and continuously monitor these environments.

We have solutions like Cacti, Nagios and players like BMC, CA etc. in this monitoring space.

How monitoring a Virtualized Datacenter is different?

With traditional Datacenter monitoring we were monitoring only the hardware, network, storage, Operating Systems and Applications. But virtualization changed the scenario. It introduced another major and vital component between Servers and the operating systems, which is THE HYPERVISOR. Thus with and without virtualization the troubleshooting and monitoring criteria changes significantly. Functionally the rest of the components remains same (Physical Server, Network, Storage and OS/Applications), but the way resource management is done in Virtualized environment is different from traditional one. Please NOTE, though I said everything is same it is actually not, with Software Defined Network and Storage it is different, but that is the subject of discussion for another time.

Let’s see how it is different in virtual environment. In traditional environment all the resources of a server is dedicated to the running operating system and in turn to the application/applications running inside that operating system (OS). Here, the operating system manages all the physical resources available in the underlying physical hardware.

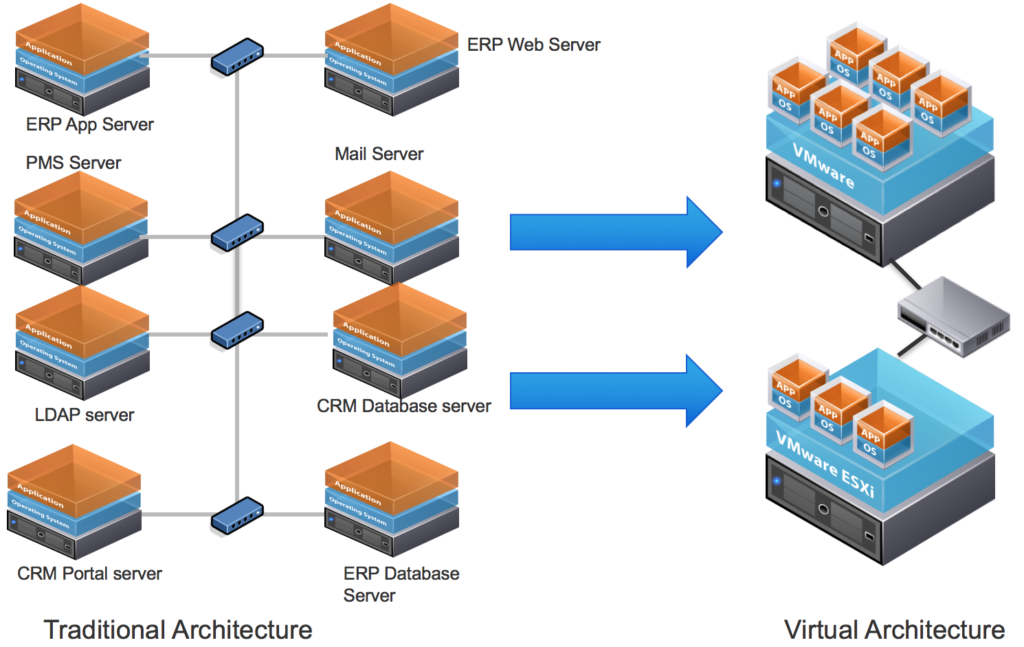
In contrast, in virtualized server, the Hypervisor manages the resources for the virtual machines and thus the resources are shared by many different VM’s and in turn the OS and Applications running inside them. But the entire process is abstracted to the OS running inside the VM. It can see only the resources provided to it by the admin and thinks it has all the resources only for it’s use which is what actually allocated for it. This is not a fact. We are tricking the VM into thinking like this. It is more clear in the following picture.

vRealize Operations Manager - 1

Traditional vs Virtual Architecture

Also troubleshooting in virtualized environment is different because a resource crunch at the hypervisor layer may lead to performance problem in VM. For example, say a virtual machine is using only 50% of all the resources allocated to it, but since there is a storage latency at Hypervisor level, the VM may perform poorly. So now you have another critical layer to monitor for. Actually, I will go so far to say that in Virtualized Environment, Hypervisor perspective is THE MOST important perspective for maintaining performance in that environment.

For obvious reasons, traditional monitoring tools fail to understand or provide the insight required for monitoring a virtualized datacenter. We need more modern, specialized and sophisticated tools for that.

So, traditional tools and way of monitoring is not sufficient for this type of Datacenter.

Next question is what to monitor for? Once you are clear about what you need to monitor then we can decide which tool to use.

What parameters to monitor?

Here I am not going to discuss about physical server, Datacenter Network or Storage health, as that remains same (not considering Software Defined Storage or network). In this blog I am going to talk only about Operating Systems or Applications monitoring. In traditional environment we are content with monitoring different parameters and metrics for server utilization (typically CPU, Memory, Network and Storage). But as discussed above, in virtualized environment what an Operating System sees inside a virtual machine is not the entire picture. It is only part of the picture.

Note: From here onwards I will be more specific to VMware environment, but the general idea and discussion can be applied to any hypervisor environment. It’s just that VMware hypervisor is more sophisticated and has advanced many technologies for managing resources which is not present in other hypervisors.

As a virtualization admin I am more interested about the overall utilization of the physical server. If a VM is under resource constraint (for example, I have given it 4 GB RAM and it requires 6 GB) and I have enough free resources at the hypervisor level, then simply increasing the resources for that VM will solve the problem. But consider the following scenario.

The physical server has 64 GB physical RAM. If I keep aside 4 GB RAM for ESXi Hypervisor, that leaves us with 60 GB RAM.

Next, let’s assume I have deployed 50 VM’s with 3 GB vRAM each in that server. So the total allocation resource is 150 GB vRAM. I am over allocating by 90 GB. Till the time VM’s use less RAM and the overall current requirement stays below 60GB this environment runs fine with no issues. But if somehow all the VM’s starts using 50% of the vRAM allocated to each of them at the same time (you cannot say NO ) then your active RAM requirement is 75 GB which is greater than what the server has (60GB) and you run into performance problem.

You see, all your individual VM’s utilization is 50%, but overall you have severe performance issue.

It is evident that in virtual environment you should monitor not only for allocation or current utilization but also for DEMAND and should be more interested about the TREND than just the current Utilization.

Using normal monitoring tools, monitoring only the current utilization is not sufficient because in virtualized environment you typically over-provision resources (if not memory then always CPU) and you need to know the trend for the resource utilization so that you can predict the utilization as well. This leads to predicting the capacity as well. You need to know well in advance when you will be out of resources and need to procure more. This is particularly important for dynamic environments where the environment grows at a faster pace (service provider or private/public cloud environment).

Also when a problem occurs in a VM, you should be able to see the entire environment from a single page and co-relate between all the different parameters and understand the cause and effect and thus finding Root-Cause of a problem in the shortest time possible.

How vRealize Operations Manager is different?

vRealize Operations Manager does all the above and more. It is not a traditional monitoring tool. It does not even monitor the parameters in real time. It collects the metrics in 5 minute interval and shows the data likewise. So in traditional sense you cannot call it a monitoring tool (in traditional sense a monitoring tool typically monitors the parameters continuously in real-time).

Though many will differ with me, but I prefer to call it an “Analytical and Forensic tool” rather than a simple monitoring tool. You can do monitoring with it, but it’s main beauty lies in the analytical and forensic capabilities. It is a Swiss knife for Datacenter monitoring and analytics.

This tool intimates you about a problem even before it arises. It warns you about the probable issues that may come in near and not so near future. It analyzes and tell you when you will be out of resources. You can run What-If scenarios (what if the utilization increases or a new project comes, when you will need to add more resources).

If any issue arises in your environment, then you can simply click on the notification and drill down to minute details to find out what caused the problem. Actually it automatically does a Root-Cause analysis and gives you probable solutions as well.

With the help of this tool I was able to find root cause of a critical issue in less than 10 minutes with all the evidence I needed, which the traditional infra teams cloud not find in 15 days (a story for a separate time).

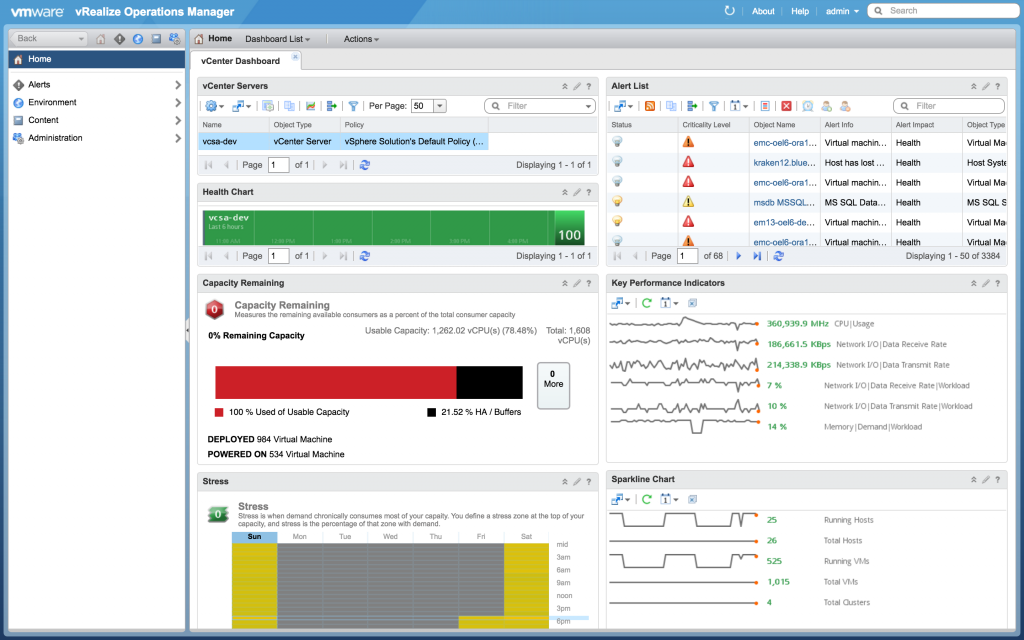
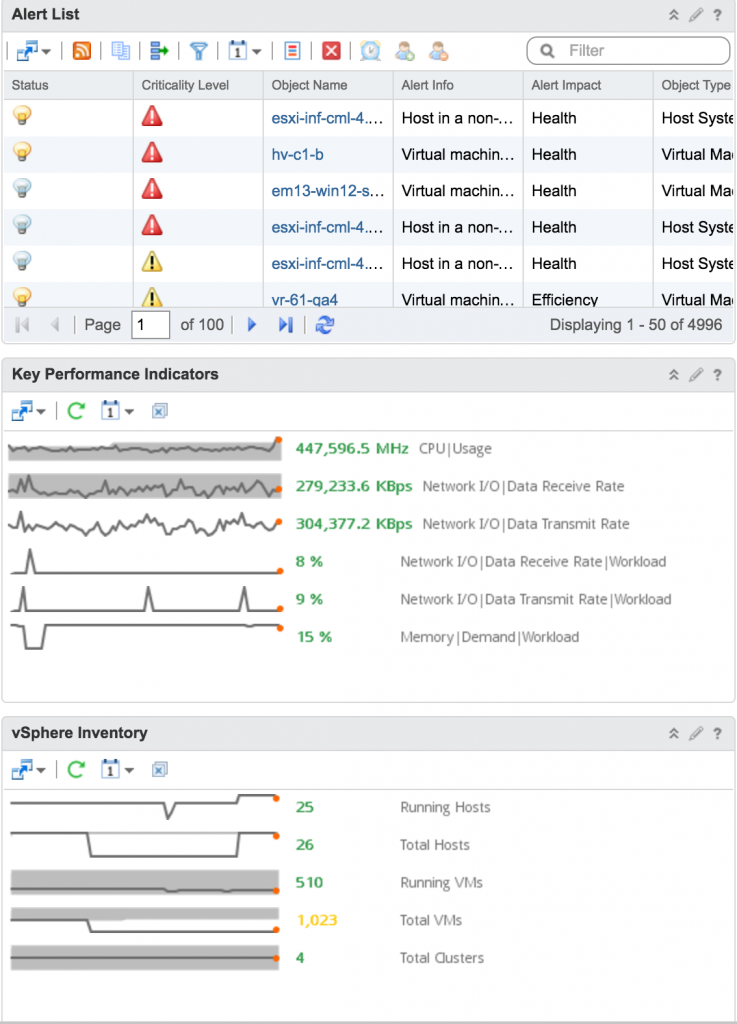
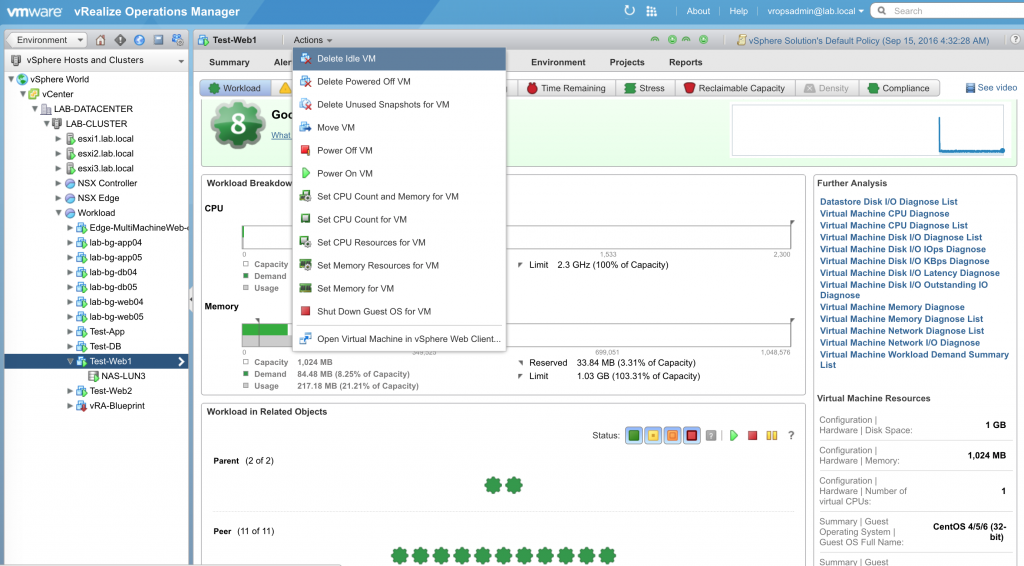
It can show you reclamation values and you can initiate those tasks from this tool. You need to analyze which VM’s taking up most of the resources in the Datacenter? No worries. Same goes for any other parameters. You need to run other analytics on any of the entities? Here you go. Like the Forensic tools and methods you use to find out a security breach, you can apply similar approach to find the root cause of any problem in your datacenter through this tool. Provided below is a screenshot showing what actions you can do on VM’s from this tool.

vRealize Operations Manager - 2

Actions available on the VM’s

It is designed and built to do a lot many things and you should focus on those. If you only want to see the current CPU, Memory, Network, Storage utilization of the VM’s then why do you need this? Any 3rd party traditional monitoring tool can do that. If you want to transform your Datacenter into a modern Datacenter with every bit of it under your control where you already know what is happening and what is going to happen then this is for you.

So you see this is not your traditional monitoring tool. It is way more than that. It is up to you whether you want to use it only to see the current utilization and compare that parameter with other tools or utilize it fully to get the full benefits.

Get your expectations right, learn how to use it, how to interpret the values and this will be the best tool you can have.

Why do the parameters mismatch?

A valid question, most often you see the memory utilization reported by OS or a reporting tool (for e.g, System Center for Microsoft Operating Systems) differ from that of vRealize Operations Manager. Why is that?

You see hypervisor has its own way of managing resources and it looks at the resources differently from that of a typical operating system. A typical operating system looks only at the memory that it is asking for. But hypervisor has different methods. For example, ESXi has four ways of physical memory management.

  • Transparent Page Sharing
  • Memory Ballooning
  • Memory Compression
  • Swapping

All of the above helps ESXi to safely give us the option to do over-provisioning of memory. So if a VM asks for new memory pages that does not always mean it is taking extra physical memory space. It may be possible some other VM has the same exact page and that page gets shared with this VM. So essentially this VM got a new page but from ESXi perspective no extra page or memory space is required to serve the request. More about these can be found here.

Hence a new memory request for a VM does not always mean a new memory page served by ESXi.

So from inside the operating system it may be reported that the utilization of that OS instance is 60%, but from vRealize Operations Manager it may report that the utilization of that VM is only 50%. Notice the difference, from inside the VM, OS reports the utilization of the OS, but from outside the VM, vRealize Operations Manager reports the VM utilization which may be different and in all probability will be less than the one reported from within.

Also when you talk about virtualization and memory management by Hypervisor, you need to know the following parameters and what they mean:

  • Allocation (Capacity)
  • Demand
  • Usage

The above three parameters as reported in vRealize Operations Manager.
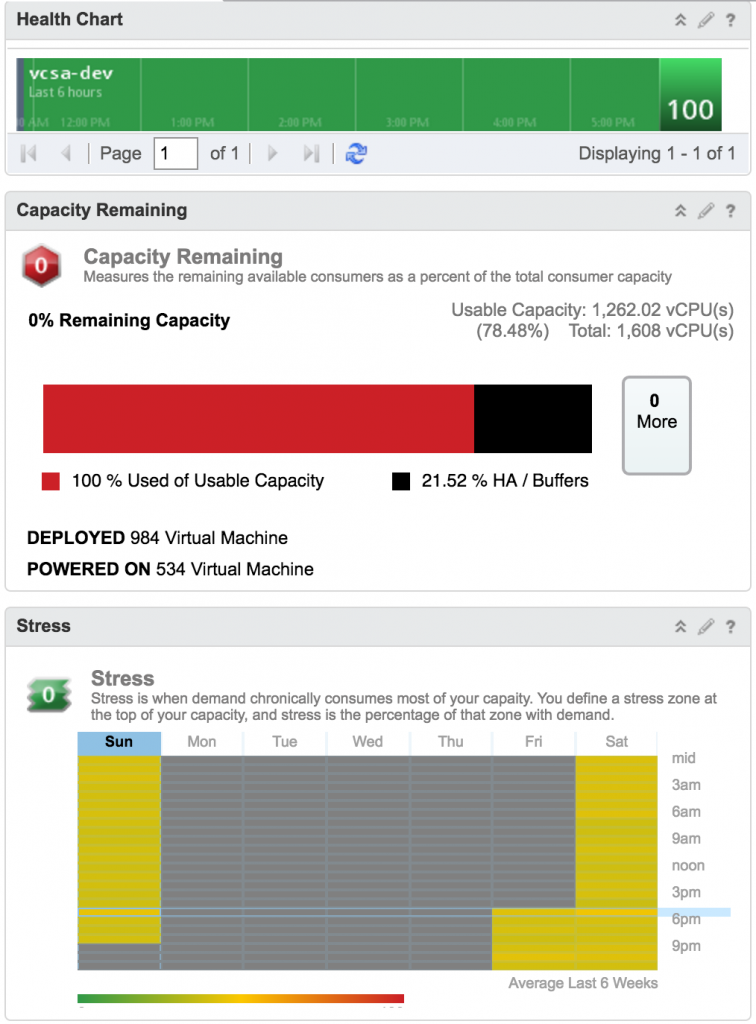
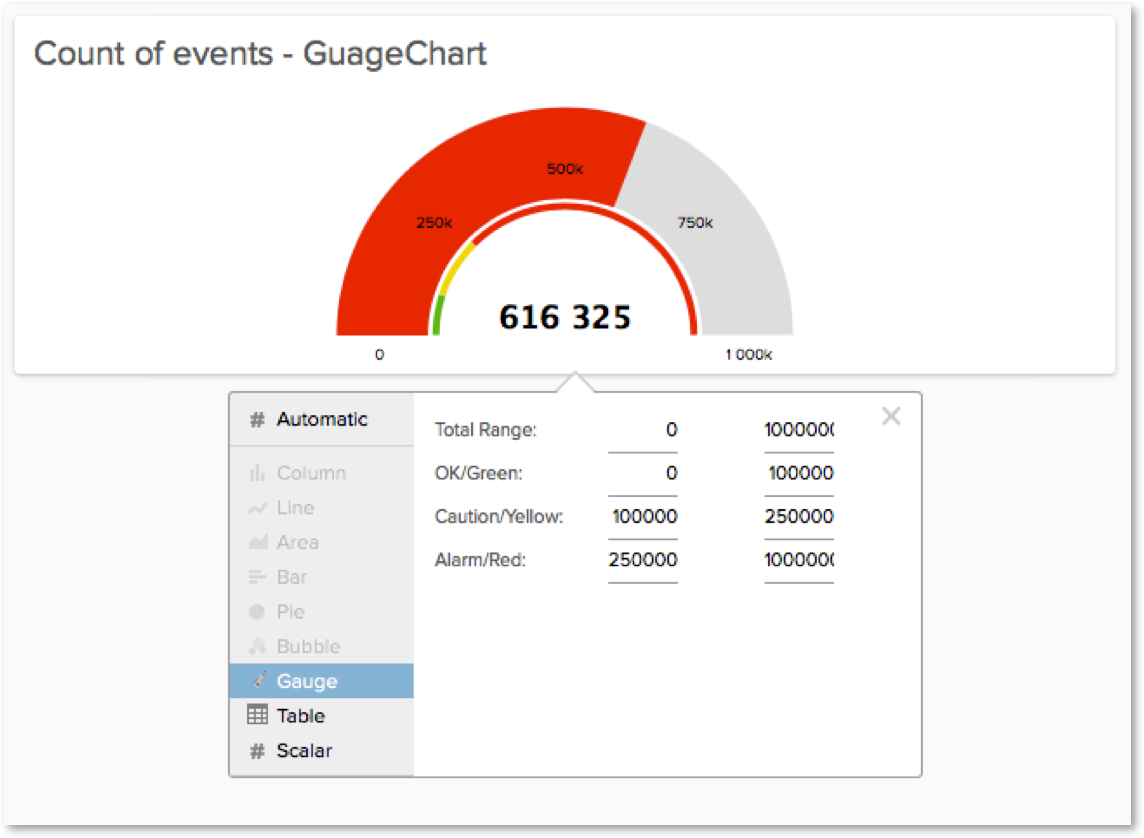
vRealize Operations Manager - 3

Capacity – Demand – Usage

Capacity (Allocation) means the amount of resources allocated to a VM. In the above picture the VM has a memory capacity of 1 GB. That means while creating the VM, 1 GB vRAM was allocated to it.

Demand, is the amount of resource demanded by the VM at any particular time. In the above picture the VM has a current demand of 84.48 MB.

Usage is the amount of resource provided by underlying hypervisor to the VM. In this case the Usage is 217.18 MB.

In a typical well performing environment Demand should always be less than Allocation and Usage.

If Demand is greater than Allocation, then you have a VM which is undersized. You need to increase resources for that VM.

If Demand is greater than Usage, then you have resource crunch/contention at hypervisor level and you should either increase resources at hypervisor level or decrease number of VM’s running on that hypervisor.

The guest of the VM or generic monitoring tools typically reports capacity and usage parameters.

In the above screenshot you can see considerably higher Usage shown in vRealize Operations Manager whereas Demand is pretty less. This is because, if there is no contention then the amount of memory assigned to a VM is not reclaimed, irrespective of whether the memory pages are active or not. In simple terms, in this case the VM once touched 217.18 MB of it’s allocated 1 GB RAM, since then the Usage is shown as 217.18 MB. Though the current demand (utilization) is 1 GB, but since the memory space was allocated by ESXi server, it is reported as current Usage. If the ESXi host is under resource contention then memory is reclaimed and the Usage goes down.

Since vRealize Operations Manager is an agentless solution and it does not collect generic utilization parameters inside the guest OS, so it has no way of knowing the utilization from Guest OS perspective. The Usage it reports is from Hypervisor perspective. Which is completely different from OS perspective? As explained above a memory requirement from Guest OS perspective does not always covert to a memory requirement from ESXi perspective. This is the reason most of the times you will see that Guest OS or other monitoring tools report higher utilization whereas vRealize Operations Manager reports lower utilization.

When calculating current Capacity or future requirement or suggesting reclamation values vRealize Operations Manager considers Demand and is aggressive in nature. This is the reason you find discrepancy in these values reported in traditional against that of vRealize Operations Manager.

Also note, when deciding whether a VM is idle or over-worked vRealize Operations Manager checks for certain parameters which is set in Policies. The policy is set in the following way:

If a VM’s CPU or Memory utilization is less than 10% for more than 90% of time, then the VM is considered as an idle VM.

Similarly, if a VM’s CPU or Memory utilization is more than 90% for more than 90% of time, then the VM is considered as an overworked VM.

The above values are examples and you can customize the percentage of time and utilization.

What this essentially means is, say in a week if a VM is 10% utilized for 90% of the times then this VM is idle. So essentially, if that VM is 90% utilized for less than 10% of time which is upto 16.8 hours within a week, still it is considered an idle VM. Your typical tool will report the 90% utilization but vRealize Operations Manager will say it is oversized and idle VM. So if the VM had 4 GB RAM, vRealize Operations Manager may recommend for 1 GB. Now if you reduce the RAM to 1 GB then the VM will face severe problem during those 16.8 hours when it requires 3.6 GB of vRAM.

Why only Badges are shown?

I have faced this question multiple times, why only Health badge for a VM is shown in vRealize Automation when you integrate it with vRealize Operations Manager. People expect and want to see realtime CPU and Memory utilization for the workloads.

Please understand what you are asking for is a very nominal thing. What this tool is providing is way beyond that. Knowing only utilization, you need to monitor it, make the decision for yourself. While making that decision at a glance you never know whether it is a intermittent spike or long standing issue. What is the final aim here? To run the application in a healthy state, right? Should you be bothered about the utilization, when the tool is taking care of all of that? It knows what the VM wants and requires and tell you whether it is HEALTHY or not. Whether the spike is well within range or a recurring issue. This is what you should be bothered about. About the state of the VM. This is what you actually want to know and this is what exactly what it shows.

Conclusion:

In conclusion, I can say the following:

  1. DO NOT COMPARE vRealize Operations Manager with your traditional monitoring tools (set the expectation right). It is NOT A SIMPLE MONITORING SOLUTION.
  2. While monitoring the VM’s, check and be concerned with the DEMAND of the VM (this is what it requires to run without any performance problems). Based on this change the allocation.
  3. Check the overall demand and usage for ESXi servers. If Demand goes beyond Usage, then you have a problem in your hand.
  4. Memory utilization reported by OS of the VM’s or other tools are more accurate than vRealize Operations Manager. As these values are reported from within the VM where they have more insight into the VM. In future releases of vRealize Operations Manager this is going to be more accurate available out-of-the-box (now you need to tweak the default policies).
  5. Check and double check vRealize Operations Manager policies and tweak it according to your environment, because every environment is different.
  6. Double check the reclaim values and apply realistically. For e.g if a VM has 12 GB vRAM and vRealize Operations Manager suggests 4 GB, don’t just reduce the value to 4 GB. First reduce the value to 8 GB, monitor for some time and if everything goes well then further reduce to 4 GB.
  7. While calculating overall capacity of hypervisor trust vRealize Operations Manager. It is based on Demand and is pretty good at predicting the load.
  8. Change the way you monitor your environment, specially if it a big one. With thousands of VMs you can not monitor utilization for each and every component. With the utilization metrics you need to find the health yourself. This tool gives it out of the box. It learns, knows and tells you about the health of the components. Take advantage of this.
  9. Go ahead give it a try. Download it from this location.

To know more about this great product please visit the documentation area. Also check the great training available from VMware Education.

Few Use cases

Following are the main reasons for which I use this tool:

  • Overall Health Monitoring
  • performance analysis
  • Troubleshooting and forensic analysis of issues
  • Capacity Analysis
  • Reporting

Do let me know which features of this product you use. How it helps in making your life easy.

The post vRealize Operations Manager – Monitoring vs Forensic appeared first on VMware Cloud Management.

New vRealize Log Insight 4.0 release

$
0
0

The leading industry log management solution, vRealize Log Insight just got better with 4.0, launching later this year. Sign up here to be notified when it’s released. Log Insight 4.0 has a new, improved and re-designed user interface, offers enhanced alert management functionalities, and is natively built for and works seamlessly with vSphere, vRealize, and other VMware products.


Log Insight 4.0

VMware vRealize Log Insight delivers Intelligent Log Management for infrastructure and applications across physical, virtual, and cloud environments. Log Insight enables administrators to connect to everything in their environment, e.g., OS, apps, storage, network devices, providing a single location to collect, store, and analyze logs at scale. vRealize Log Insight 4.0 is coming and includes the following new features and much more.


Log Insight 4.0 New Features Include:

New Server Capabilities

· New Clarity UI

· vSphere 6.5 compatibility

· New Admin Alerts Management UI

· Octet-framing over TCP

· Public Installer APIs


New General UI Items

· DeviceID to name Aliasing

· New “field does not exist” filter

· New gauge chart

· New “blur” on session timeout


New Look – Clarity UI

New Log Insight 4.0 Clarity UI

The new vRealize Log Insight user interface uses a new, cleaner design based on the Clarity standard. Updated features include a new skin, a replacement of checkboxes by toggle switches, new Does Not Exist filter used to find events that do not contain some specified field, a new Gauge Chart visual display tool, and many more awesome new features.

New Admin Alert Management

log-insight-4-new-ui-admin


A new Admin Alert Management tool and UI allows for a single interface to view and manage alerts. This includes the ability to share alerts and view historical alerts across time.  Additional alert capabilities include a new system notification for when Event Forwarder drops are detected, an updated Event Type alert that now supports a time range, and a new ability for users to subscribe to content pack alerts that allows for automated upgrading inline with the associated content packs.


New Gauge Chart

log-insight-gauge-chart

vRealize Log Insight 4.0 introduces a new Gauge Chart display visual tool. The new Gauge Chart allows users to quickly display aggregate log data into a speedometer like view to meter and measure the general status of systems and/or applications being monitored. The Gauge Chart is color-coded in red, yellow or green to provide additional performance context intuitively.


vRealize Log Insight comes with built-in knowledge and native support of vSphere and other VMware products, like VMware Horizon with View, vRealize Operations and vRealize Automation. Log Insight 4.0 is fully compatible with the new vSphere 6.5 release and will be able to start collecting and managing VMware logs intelligently from the get-go.


vRealize Intelligent Operations: Better together 

Log Insight integrates with vRealize Operations to bring unstructured and structured data together, for significantly enhanced end-to-end operations management. To gain the benefits of intelligent operations management for your entire data center, consider vRealize Operations (which provides strong integration with vRealize Log Insight). Get a free trial now.

To find out more about Log Insight, visit our Log Insight page.

The post New vRealize Log Insight 4.0 release appeared first on VMware Cloud Management.

vRealize Log Insight 4.0 just launched!

$
0
0

On behalf of VMware I am pleased to announce VMware vRealize Log Insight 4.0.0, the Intelligent Log Management solution for Infrastructure and Applications, is now GA and live on www.vmware.com.

You can download it now.

vRealize Log Insight

What’s New?

  • General
    • vSphere 6.5 compatibility.
    • System notification enhancements.
    • Support for custom SSL certificates in the vCenter Server edition.
    • Support for Spanish locale(ES).
  • UI Features
    • New overall User Interface based on the VMware Clarity standard.
    • New speedometer-like Gauge Chart type for event count visualizations.
    • New Admin Alert Management tool and UI to view and manage all user alerts.
    • New filter called Does Not Exist to find events that do not contain some specified field.
    • Support for Datastore Device ID-to-name aliasing in event queries and results.
    • New “blur” on session timeout.
  • Server Features
    • Support for Syslog octet-framing over TCP.
    • Defined REST APIs for installing Log Insight servers and clusters.
    • Support for time ranges with Event Type alert queries.
  • Agent and Importer Features
    • SLES 11 SP3 and SLES 12 SP1 are supported for Linux agents.
    • The dateext (daily extension) option of logrotate is now supported.
    • SSL for the vRealize Log Insight agent is now enabled by default.
  • Content Pack Features
    • Users can now subscribe to content pack alerts that allow automated updates inline with the associated content pack.
  • Changed Behavior
    • New Agent installations have SSL enabled by default. Previously, Agent installs defaulted to SSL off. Upgrading does not affect current SSL settings.
    • New event forwarder destinations now default to verifying SSL certificates. Previously, SSL certificates were not verified by default. Upgrading does not affect current settings.
    • vRealize Log Insight for vCenter now allows you to change SSL settings.
    • For content pack alerts instantiated in 4.0, content pack updates now automatically update alert definitions. If needed, you can preserve customizations by exporting them and then importing them back into the user profile after the update is applied.

For more information on what specific features that are being released for vRealize Log Insight 4.0 please visit our previous Blog post describing product release in detail here: http://blogs.vmware.com/management/2016/10/vrealize-log-insight-4-0.html 

Got questions? Leave a comment below.

The post vRealize Log Insight 4.0 just launched! appeared first on VMware Cloud Management.

What’s new in vRealize Log Insight 4.0: An in-depth review

$
0
0

We’re pleased to announce the new release of vRealize Log Insight 4.0. You can download the new release here.


vRealize Log Insight


Read on to learn more about vRealize Log Insight 4.0 !

Let’s begin with some …

New overall User Interface based on the VMware Clarity standard

  • LI attempts to leverage the VMware Clarity theme.
  • This new UI give Log Insight a cleaner and leaner look and feel.
  • Do not panic everything is still in its place only with a make over …

Clarity is an open source design that combines UX guidelines, an HTML/CSS framework components. Clarity is meant for use by both designers and developers. For more information on the Clarity standard refer here.

Clarity UI


Clarity UI

Moving on to some …

General Enhancements

Lots of other general enhancements that have been much asked for from the user community have been addressed in Log Insight 4.0 … we are listening. Some of which are:

In vRealize Log Insight v 4.0 you will also see a Blur on session timeout –

whats_new_vrli_40_pic3


System Notifications:

  • Normal upgrade operation system notifications are now suppressed.
  • New system notifications for duplicated alerts.
  • New system notification for when Event Forwarder drops are detected
Duplicate alert notification


whats_new_vrli_40_pic5

Event forwarder events dropped notification


We already told you about User alerts that can now be created to alert based on new event types in vRLI 3.6, but in vRealize Log Insight v4.0 we take it step further.

  • You can now select a time range with Event Type alert queries.
Time based event type based alert

In vRealize Log Insght 4.0 Users can subscribe to content pack alerts that allow automated updates inline with the associated content pack.

Content pack alert vs alerts in user space

Another interesting feature introduced is the ability to Selectively disable system notifications with regular expressions.

  • <alerts>
    • <disabled-notifications>
    • <notification pattern=”Repository Retention Time .*” />
    • </disabled-notifications>
  • </alerts>

There will be no system notifications during upgrade in vRLI 4.0 , so no need to use above feature to disable notifications during upgrade!

In vRLI v4.0 we have added a New filter called Does Not Exist to find events that do not contain some specified field.

Field does not exist filter

Some of the new agent features available in vRLI v4.0 are :

Another interesting feature is vRLI v4.0 compatibility with vSphere v6.5

  • vSphere 6.5 supports old interface that LI uses which means Log Insight version 3.0 and newer is compatible with vSphere 6.5
  • Although vRLI 3.0 & newer will work with vSphere 6.5 ; the content pack has not yet been updated for vSphere 6.5 specific logs and hence all of the new logging in 6.5 has not been added to the content pack YET!
  • Existing vSphere content pack widgets will continue to work with vSphere 6.5
vSphere content pack v4.0

vSphere Content pack updates include

  • New Widget for VMs Unregistered
  • No new dashboards added this release
  • Bug fixes
  • NOTE:
    • Content pack & Agent group has not thoroughly tested for vSphere 6.5 as you cannot install the agent on VC 6.5 as it is on the Photon OS so we officially do no support it yet although they will work
    • vSphere 6.5 specific widgets and dashboards are not in the content pack v4.0 yet and will be separately released.

And now for some of the most asked for features from the user community –

New admin alerts management UI

  • Ability for a user with admin permissions to Edit and Delete user alerts from administration UI
  • Filter by alert name , owner name , content pack or show only enabled alerts.
  • Table can be sorted by columns and hover over shows additional information.
Admin alert management UI Admin alert management UI

Additional little tidbits of information about alert management:

  • Older functionality for a user to manage their own alerts will continue to work as before from Interactive Analytics.
  • All user alerts can be suspended from alert management UI – this is same as old functionality the checkbox has been moved from the previous Administration \ General page to the Alert management UI page.
  • Suspend alerts functionality – All user alerts are now suspended. No alerts (even for admin user) will run until the suspension is lifted.
  • When suspend alerts is ON – system notifications are unaffected, including those related to node connectivity.
  • Avg run x Frequency = Daily Run ; when table is sorted by Daily run it allows administrator to find out the most expensive alerts and take corrective action.
  • User Alerts auditing information is available in both runtime.log (for backend actions) and ui_runtime.log (for UI instrumentation)

Syslog octet-framing over TCP:

  • Octet counting is defined in RFC 6587 and required by RFC 5425, which RFC 5424 requires as well and is used by RFC 5425 -compliant Syslog relays.  Unfortunately, prior to LI v4.0 when Log Insight is used in conjunction with these relays it tended to mishandle a octet count framed message.
  • Solution: You can install syslog-ng, this can be used to generate a octet count framed message:
    • /opt/syslog-ng/bin/loggen –inet –stream –syslog-proto –number=1 –sdata “[mdc@16700 category=\”Log\” component=\”loggen\” logType=\”Log\” sourceType=\”Platform\” tag=\”test123\”]” loginsight-qa 514
  • In versions prior to vRLI v4.0 users will see this in Log Insight:

256 <38>1 2016-09-07T09:02:50+02:00 localhost prg00000 1234 – [mdc@16700 category=”Log” component=”loggen” logType=”Log” sourceType=”Platform” tag=”test123″] seq: 0000000000, thread: 0000, runid: 1473256970, stamp: 2016-09-07T09:02:50 PADDPADDPADDPADDPADDP

  • In vRLI 4.0, user should see this:

2016-09-07T09:02:50+02:00 localhost prg00000 1234 – [mdc@16700 category=”Log” component=”loggen” logType=”Log” sourceType=”Platform” tag=”test123″] seq: 0000000000, thread: 0000, runid: 1473256970, stamp: 2016-09-07T09:02:50 PADDPADDPADDPADDPADDP


Supported deployment APIs

  • With every release of vRLI we are looking to add more supported APIs for use.
  • You can find the list of supported deployment APIs here:
  • Note:
    • It is a requirement to use port 9543 (not 443).
    • API for deployment/new does not require authorization since admin password is blank by default

And last but definitely not the least, as part of our continuing efforts to make the user community excited about using vRealize Log Insight …

We have added an attractive visualization for single values, where the user can decide what is “green”, “yellow” or “red”.

Typical application would be representation of  CPU utilization, memory utilization on charts …

The user can change the ranges, however

  • the ranges stay contiguous
  • the values are increasing from green to red
  • there are always only 3 color ranges
  • a new query resets the ranges

The chart can be saved to the dashboard and the user can change the ranges and the chart type there as well …Gauge Charts

Unsupported use cases

  • No more than 3 ranges are allowed (we don’t support the case, for example where the “green” range would be in the middle, and yellow then red would be at lower and higher values)
  • The 3 ranges cannot be discontinuous.
  • The green always cover the lower values and the red, the larger values. We do not support the “decreasing case” where the good values are the highest (negative values are OK: -50 for the min for example and 0 for the max, but decreasing values, e.g. -50 for the max and 0 for the min, are not OK)
  • As a result of the first 2 conditions, the max of the green range is equal to the min of the yellow range, and the max of the yellow range is equal to the min of the red range.

And that is not all we also have some unsupported Tech preview features that we’d like you to try …

Tech Preview Features

Note: Tech Preview features are disabled by default, come with no support, and may be changed or removed in a future release.

Agent auto-update –

Some Use Cases we try to address are:

  • As a user, I do not want to manually upgrade agent on each node.
  • As a user, I want the upgrade to be as silent as possible (e.g. no user interaction should be needed).
  • As a user, I want the auto-update to have same effects as manual one.


Agent auto update

Agent Scripted Input –

Agents can be configured to run script and collect output allowing for addition collection sources as well as data massaging.

  • Create an object of ScriptedInput class.
  • Call Configure() and Start() methods.
  • After Start() the thread context will return, the real work will be continued in other threads.
  • When needed call Stop() to interrupt the ScriptedInput’s threads.
  • In case of errors in ScriptedInput’s background threads the error messages will be logged, error during Start/Stop will be thrown and should be handled by client code.

Configuration details to make scripted input work:

  • To make Scripted Input work one should have a [scriptlog] section in configuration file, each section should contain “script” option(mandatory) and can contain other options described bellow:
  • [scriptlog|job1]
  • ; “hello_World.bat” is the script to be run, it script should be located in “scripts” directory alongside with agent binary… i.e. for linux in /usr/lib/loginsight-agent/bin/scripts and in “C:\Program Files (x86)\VMware\Loginsight Agent\scripts
  • script=hello_World.bat
  • charset=utf16 ; job’s stdout encoding, default is utf8
  • event_marker=\t ; the separator events, default is \n

VMware Identity Manager (vIDM) Integration

Authentication via vIDM can be configured allowing for Single Sign-On.

Enable vIDM integration from Administration \General page UI  and save.

Enable vIDM

Then go to https://li /admin/auth or access it from UI’s top right corner – Administration -> Authentication. There you’ll see AD and vIDM configuration page, so you can input your AD and/or vIDM related info and save.

To be able to login via vIDM user you should import group or user from Administration -> Access Control page.

Limitations:

  • Requires vIDM 2.6 or newer.

Some Useful links:

Got questions? Leave a comment below.

The post What’s new in vRealize Log Insight 4.0: An in-depth review appeared first on VMware Cloud Management.

Predictive DRS

$
0
0

Resource contention is one of the most critical issues in any virtualized environment.  When contention occurs, applications slow down and your users are affected.  Up until now two different methodologies have been employed to mitigate the risk of contention, with varied results.  But now I want to introduce you to the new “game changing” method available from VMware: Predictive DRS!  But first a bit of a history lesson on the original two methods.

Reactive Method

The first of these is the Reactive Method which focuses on resolving unexpected resource demand.  The most widely used example of a reactive solution is VMware’s Distributed Resource Scheduler, or DRS. As the day progresses, workloads may need more resources, which can lead to contention on the host.  The reactive method moves VMs around to ensure all workloads get the resources they need and applications remain healthy. Note this method needs only a minimal amount of VMs to be moved in order to be effective, which means minimal overhead. The reactive method only moves VMs when contention approaches, so it’s possible (however remote) for users to feel some effects of the contention before it’s resolved.

reactive

Balanced Method

The next approach, the Balanced Method, has become more popular recently. This method focuses on balancing workloads across hosts and clusters to mitigate the risk of growing workloads. This can be an effective way to avoid hot spots by spreading workloads out evenly. However, the constant movement of VMs every day means the potential for overhead is huge. There is also no guarantee that a balanced environment will avoid all contention, so the Reactive Method is still needed here.  VMware DRS can be configured to use the Balanced Method and, together with vRealize Operations, can balance workloads both within and across clusters in your environment.  DRS and vR Ops allow you to set the amount of balance you are trying to drive, thus allowing you to control how much overhead you are willing to tolerate to obtain that balance.  In vSphere 6.5, an additional policy is exposed in the DRS configuration screen that provides the option to choose balance based on number of VMs rather than load (although in cases of extreme resource contention, the VM number might become uneven in order to keep workloads happy). It’s important to note this method is very popular among a lot of niche vendor products.  They may give it a fancy name to make it seem like it is doing something more, but in the end it falls into the balance bucket.

balanced

Predictive Method

The newest approach is the Predictive Method, currently offered only through VMware‘s new Predictive DRS option.  Predictive DRS using a combination of DRS and vRealize Operations Manager to predict future demand and determine when and where hot spots will occur.  When future hot spots are found, Predictive DRS moves the workloads long before any contention can occur. Even better, this means with the Predictive Method only the required workloads are moved, resulting in minimal overhead.

So how does Predictive DRS work?  It starts by leveraging the Dynamic Thresholds of vRealize Operations (one of the core functions of vRealize Operations), which understand the behaviors of all workloads throughout the day. vRealize Operations collects hundreds of metrics across numerous types of objects (Hosts, Datastores, VMs, etc) every day.  Each night it runs its Dynamic Threshold calculations which uses sophisticated analytics to create a band of what is “normal” for each metric/object combination.  The band has an upper and lower bound of normal for each metric associated with object.  So for example if we have a simple app server VM, it will show the VM does not use a lot of CPU early in the morning.  But at 8am when people start logging into the system, the CPU load will spike very high.  It will then taper off around noon as people go to lunch, and then back up again for the rest of the day until people go home.  And don’t forget about the nightly reports which run at 2AM and spike CPU.

dts

The great thing about Dynamic Thresholds is that they are tailored to each individual VM and application.  There is nothing you need to do; the analytical engine in vRealize Operations takes care of everything.

Once vRealize Operations has calculated its Dynamic Thresholds we have 3 fundamental data points:

  • How many resources is each VM going to need throughout the day
  • What VMs are on running on what hosts?
  • How big is each host?

Once we have those we can ask the most important contention mitigation question of all, “Will any of my hosts struggle to serve my workloads today”?  If the answer is “Yes” then let’s move a few VMs around to avoid that future contentious situation.  That’s Predictive DRS in a nutshell!

what-is-pdrs

Which Method Should You Use?

So Predictive DRS is a game changer, but in a complex datacenter like yours, all three risk mitigation methods are required to fully manage contention. Fortunately, VMware DRS and vRealize Operations offer all three, in one cohesive solution.

You do not have to settle for one or the other and most importantly you are in control with vRealize Operations and VMware DRS.  For more information on the latest vRealize Operations release please read the vRealize Operations 6.4 blog.

pdrs

The post Predictive DRS appeared first on VMware Cloud Management.

Predictive DRS Walk Through

$
0
0

As you may recall, in the first Predictive DRS management blog post we discussed the three different methodologies that can be deployed to avoid contention, the value of each of them brings to the table and why its important to deploy all three in your datacenter.  In this blog and in the video below will focus on a Predictive DRS walk through showing how simple it is to configure the Predictive DRS feature in both vRealize Operations 6.4 and vSphere 6.5.  This  walk through will also serve as a great demonstration of the solution and give you a view into how it all comes together.  After watching the video you should be easily able to configure it in your environment and start seeing the benefits of Predictive DRS.

So as you can see Predictive DRS is a game changer but you will need all three risk mitigation methods are required to fully manage contention. Fortunately, VMware DRS and vRealize Operations offer all three, in one cohesive solution.

combo


You do not have to settle for one or the other and most importantly you are in control with vRealize Operations and VMware DRS.  For more information on the latest vRealize Operations release please read the vRealize Operations 6.4 blog.

The post Predictive DRS Walk Through appeared first on VMware Cloud Management.


Automating Virtualization & Cloud Management: Realizing Upsides Can Mean Uncalculated Risk

$
0
0

Automation risks can often offset rewardsAutomation tools meant to facilitate application management may get you more—or less—than you bargained for, particularly as your organization matures along its software-defined journey. Underlying approaches to automation vary widely and not just because, obviously, different vendor’s solutions differ. There’s that, of course, and you already know that even two relatively ‘apples to apples’ solutions can perform differently in the same production environment for any number of reasons. But there’s more: using third party automation tools may introduce a level of risk into your application management architecture that wouldn’t otherwise exist. Worse: sometimes the downside takes a while to understand, by which time you could have a problem on your hands worse than the one the tool was purchased to solve!

How can this be? To understand it fully, and thereby keep the decision-making power in your hands where it belongs, requires a shift in the minds of some IT practitioners: it takes an application-centric approach. Applications do not perform exactly the same in any two production environments. In today’s highly dynamic virtualized and cloud environments, workloads are moving across clouds and back again and may perform differently as they do so. Many third party tools follow narrow rules and use static metrics that could incorrectly deem something a problem when it’s a “normal” anomaly for that application in that setting. For instance, a tool may alert you to excessive activity but the “automated fix” actually causes downtime elsewhere. IT managers need an understanding of the solution’s underlying philosophy.


Many vendors use a “one size fits all” approach to workload automation

This approach can result in capacity miscalculations through an overweighting of the value of “rightsizing.” Many tools lack a holistic view of the enterprise, delivering only limited static metrics and unable to accurately diagnose overall system health. Niche solutions may be adequate for limited server virtualization, but won’t scale out with the sophistication you need. Customers are surprised to discover they need to augment missing capabilities with other vendor’s products in order to retrofit essential functionality. That correction can lead to duplication in other functionalities, resulting in inefficiency and negation of anticipated cost savings – e.g. excessive movement of workloads can result in high overhead, and thus the value gained is negligible. The screenshot below illustrates how VMware vRealize Log Insight can give users a “behind the scenes” look at how a 3rd party automation tool can potentially negatively impact your environment.
Log Insight tracks automation events

As your enterprise extends into the cloud, third party tools vetted for simpler times may not effectively make the journey with you, so, at a minimum, you take on the onus of continual re-evaluation of your tools that may not be worth the energy saved by using them.


As an enterprise evolves in its software-defined journey, the risk introduced by third party automation tools becomes greater

A fully virtualized stack, with storage, networking, and compute, is simply more complicated than just server virtualization. Third party tools may work well as you scale up, but as you scale out to tens of thousands of VM’s, the only way to have high levels of certainty for your business-critical applications is with an automated control plane that’s natively integrated with the stack. Moreover, tapping the full benefit of that virtualized stack—taking it to a hybrid cloud environment for breakaway efficiency and agility—requires a sophisticated control plane to orchestrate your highly dynamic virtualized and cloud environment.

Simply put, it’s about decision support. Some vendor’s approach to “automation” is to relieve you of the “headache” of knowing what’s going on in your environment. So, for example, a tool may identify a VM server whose health is degrading and move the workload—but it fails to fix the server. Again, this may not be problematic in one data center with a few hundred VMs, but scale out to tens of thousands, and you’ve introduced the risk that comes from having rules in place that may not bubble up problems like downed VMs while they’re still simple to fix.

To realize the vision of the self-healing data center requires a management control plane that delivers accurate and actionable data. A policy-based approach, rather than a rules-based approach, can more properly discern what data is critical to deliver to you. An integrated approach to operations management ensures application uptime by learning your environment’s particular needs. Optimal management in the era of the modern data center and cloud requires an approach based on learning and correlating the right metrics based on application behavior in order to identify the most actionable data. Competitive approaches tend to treat all resources equally, as commodities in your ecosystem, and deal with situations according to a basic set of rules, with no intelligence—just a straightforward “when A happens, do B” approach. This fails in a fully virtualized and cloud environment. Practitioners in this environment need advice on how best to remediate problems based on a holistic view. A policy-based unified management console can point out configuration issues, performance bottlenecks and opportunities to rightsize over provisioned capacity—in other words, not just move a workload when there’s a problem (it can do that too!), but continually monitor your dynamic environment and adapt accordingly.  Tracking anomalies in a system of self-learning behavioral analytics rapidly drives time to benefit, helping not only to keep your apps safe and productive but supporting accurate capacity planning.

As discussed in an independent research report from the University of Waterloo, integrated OS and application monitoring drive the intelligent workload management needed to make the self-healing data center a reality. The intelligent operations and automation provided by vRealize Operations, coupled with VMware Predictive DRS, allows you to get more out of vSphere, and SDDC environment, with easy to use capacity management and performance monitoring. Using self-learning analytics, an integrated management console can guide remediation with recommended corrective actions and automatically reclaim over provisioned capacity for optimal resource utilization.


Analyst firm Tenaja Group recently cited VMware vRealize Suite as a leader in all aspects of cloud management

The Tenaja report includes cloud automation, cloud operations and cloud business/financial management. Key takeaways from this study:

  1. Truly comprehensive cloud management platforms are rare and will become increasingly essential for the holistic view modern enterprises need,
  2. Despite what vendors say, most cloud management toolsets are optimized for particular environments (and often operate best in a proprietary environment), and
  3. Few tools operate well in a cross-cloud environment. For example, Microsoft cloud management is specifically designed for Azure clouds with Hyper-V and HPE cloud management for HPE’s flavor of OpenStack clouds. Indeed, lack of standards makes cloud interoperability challenging.
taneja-chart

Legend: VMW=VMware, MSFT=Microsoft, SVN=ServiceNow, HPE=HP Enterprise, CSCO=Cisco, RH= RedHat, SPL=Splunk, VMT=VMTurbo

Source: Taneja Group, 2016

The software-defined journey is about more than IT; it’s an approach to modern business, one that’s increasingly necessary to deliver the kind of customer experiences needed to stay competitive. The application has become more and more central to your customer’s experience with your brand, and the underlying infrastructure that delivers that experience is best managed by a unified management console that becomes intimate with applications, no matter where they reside.

The post Automating Virtualization & Cloud Management: Realizing Upsides Can Mean Uncalculated Risk appeared first on VMware Cloud Management.

Announcing the vSAN Management Pack for vRealize Operations

$
0
0

Have you deployed or are considering vSAN for your vSphere 6.0U2 or 6.5 environment? If so, you should know about VMware’s new VMware vRealize Operations Management Pack for vSAN 1.0 released last week. The vSAN management pack is specifically designed to accelerate time to production with vSAN, optimize application performance for workloads running on vSAN and provide unified management for the Software Defined Datacenter (SDDC).

Accelerate Time to Value

With over 5,500 customers, vSAN is a proven technology transforming the storage market and enabling customers to modernize their datacenter. vSAN is applicable for many use cases including business critical applications, remote or branch offices, virtual desktop infrastructure, business continuity and more.  Many customers start with a subset of these use cases and over time develop trust in vSAN for almost all their use cases.  With the vSAN management pack, you can gain insights about the impact of vSAN in your infrastructure quickly, and bring your business greater efficiency in a shorter amount of time.  This can be helpful to showcase the impact of vSAN and evaluate it, not only for the use cases you have in mind today but as you expand into the future.  With the vSAN management pack, you can gain confidence quickly with vSAN while avoiding the risks and blind spots.

For example, as you migrate workloads onto vSAN, the management pack provides historical performance for key storage performance indicators as well as trending future demand. With this information, you can easily confirm that your applications are healthy and happy running on vSAN. After all, we know the newest technology is the first suspect. Having “proof of innocence” with the vSAN management pack’s vSAN Optimization Dashboard provides the confidence you need. It answers important questions during the initial stages of evaluating and deploying vSAN:

  • How is my application performing on vSAN versus non-vSAN storage?
  • Is my vSAN configured properly?
  • Is my vSAN healthy?
ss1

Deploy vRealize Operations with the vSAN management pack to accelerate your time to value and begin enjoying the benefits of software defined storage.

Optimize Application Performance and Improve Efficiency

It can be challenging to strike a balance between the demands of your business and the cost of delivering IT services.  You are probably looking to vSAN to help solve this problem, drive better efficiency out of IT spend and increase critical application performance and availability.  By leveraging the vSAN management pack, you can be assured that the goals you set for vSAN are being met.  You can also look for other opportunities to squeeze cost out of your data center.  And with vSAN management pack, planning for growth and expansion will be quick and easy.

As the lines between efficiency and performance get closer, the buffer zone for troubleshooting and finding problem root cause gets smaller.  Storage issues can be very painful and it is better to stay ahead of those issues than to wait until they manifest as application outages.  Having vRealize Operations with the vSAN management pack allows you to deliver the most out of your vSAN environment with:

  • vSAN specific dashboards, alerting and health checks
  • Cross-silo performance evaluation to monitor the impact of workload and policy changes
  • Root-cause analysis from application to virtual machine to host for full stack troubleshooting
  • Capacity reporting and “what-if” scenarios for planning and budgeting
ss2

Add the power of vRealize Operations’ proven performance analytics to get the most out of your vSAN investment.

Unified Management for the SDDC… and beyond!

Cloud economics means abstraction with transparency.  You must be able to manage both on premises and public clouds from the same platform.  VMware’s cloud management platform gives customers a complete, 360 degree view of infrastructure, virtualization, applications and services through vRealize Operations Manager.

Get Started

If you already have vRealize Operations, download and install the Management Pack for vSAN from VMware Solution Exchange.  There’s no cost and customers who own any edition of vR Ops are entitled to install and use this solution.

Not a vR Ops customer?  No problem!  VMware provides an evaluation program so that you can try it out in your environment with all features enabled – you can even install the Management Pack for vSAN once your trial copy is installed.

The post Announcing the vSAN Management Pack for vRealize Operations appeared first on VMware Cloud Management.

The Self-Healing Data Center (Part 2) – Installing the Webhook Shims for Automating Alerts

$
0
0

In the previous post, I explained how vRealize Operations with vRealize Orchestrator can automate alert notifications via the REST Notification plugin to enable a self-healing datacenter.  I also introduced the Webhook Shims as the solution that provides the underlying capability.  In this post, I will walk you through installing the Webhook Shims in your environment and setting up a simple use case to test things out.

A Basic Use Case for Self-Healing

For example, you probably know that vRealize Operations can monitor services on a supported OS through Endpoint Operations.  If that service becomes unavailable, vRealize Operations can alert you.  But wouldn’t it be nice if vRealize Operations attempted to restart the service first?  Why bother an administrator for such a simple task?  If it still doesn’t respond after an automated restart attempt, then you may want a human to take a look.

Let’s begin with installation of the Webhook Shims.  For this you will need an environment capable of running Python 2.7 (the language used to build the shim).  If you already have a Python 2.7 environment with virtualenv installed, you can skip over the next section.

Also, there are some modules in the Webhook Shim that don’t play well with Windows, so I strongly recommend a Linux OS here.

Installing Prerequisites on Photon OS

To keep things simple, I’ll use a virtual machine created with the Photon OS OVA (as it already comes pre-loaded with Python 2.7).  Once you have the Photon OVA deployed, you can open an SSH session and log in with root and the password changeme (which will prompt you for a password change).

The first thing we need to do is install wget.  Enter the command

tdnf install wget -y

Now we can use wget for the next step, installing pip and virtualenv for Python.  First, grab the pip installation script with wget

wget https://bootstrap.pypa.io/get-pip.py

Now you can install pip using the script we just downloaded.  What is pip?  It is a package manager for Python, sort of like how yum is for Linux (or in the case of our little Photon OS, tdnf).

python get-pip.py

Finally, you are ready to install virtualenv using pip.  By the way, virtualenv is not a requirement, it just is a good practice to avoid contaminating your nice clean Python install with modules that are unique to a given environment or may require different module versions.  Anyway, install virtualenv

pip install virtualenv

Congratulations!  Prerequisites are complete and we can get busy installing the shim.

Installing the Webhook Shims

Now that we have our environment ready, let’s begin the Webhook Shims install.  For this, we’ll use git to pull the repository down, so we will need to install that first.


tdnf install git -y

Great.  Now we can clone the Webhook Shims repository from github.


git clone https://github.com/vmw-loginsight/webhook-shims.git

Using a git repository allows you to update the Webhook Shims easily whenever a change is made (i.e. fixes or enhancements) to the main branch.


At this point, we can create the virtual environment for Python, using virtualenv.  As the readme on the Webhook Shims repository github page suggests, we will use venv-webhookshims.  We will create this environment in the repository directory.


cd webhook-shims

virtualenv venv-webhookshims

Now you will see why we are using a Python virtual environment.  The Webhook Shims has some modules that are required that are not included in the default Python library.  We will need to install those into the virtual environment we just created.  First, we will activate the virtual environment and then install the prerequisites.  This is easier than you might think, because the repository contains a file with a list of the prerequisites so we just have to reference that file with pip.


First, activate the virtual environment.


source venv-webhookshims/bin/activate

Notice the prompt changes to let us know we are in a virtual environment.  The OS will function as it normally does, the only difference is that the Python library will include any modules we add while in the virtual environment.  By the way, to exit the virtual environment, simply enter deactivate at any time.


Installing the prerequisites, as I mentioned, is easy.  There is a file in the repo named requirements.txt that contains all the modules needed to run the Webhook Shims.  Using pip we can simply reference that file to install them.


pip install -r requirements.txt

Now that was easy!  At this point you have installed the shims and are ready for the next step – configuring and running the Webhook Shims.  I will cover that in the next blog post.

The post The Self-Healing Data Center (Part 2) – Installing the Webhook Shims for Automating Alerts appeared first on VMware Cloud Management.

VMware on VMware: vRealize Network Insight

$
0
0

vRealize Network InsightHow VMware IT Leverages vRealize Network Insight


VMware IT uses many VMware tools in their IT organization to manage their private cloud. One of these useful tools is vRealize Network Insight.

What is vRealize Network Insight?

VMware vRealize® Network Insight™ delivers intelligent operations for software-defined networking and security. It helps optimize network performance and availability with converged visibility across virtual and physical networks, provides planning and recommendations for implementing micro-segmentation based security, and provides operational views to quickly and confidently manage and scale VMware NSX® deployment.

There are 2 use cases of VRealize Network Insight deployment in VMware IT featured in the video below.

Watch the vRealize Network Insight dogfooding video here:

The vRealize Network Insight video featured below has Swapnil S. Hendre talking about how we are using vRealize Network Insight for Micro-Segmentation in VMware’s production infrastructure and John Tompkins who talks about how we are using vRNI to manage one of the largest VMware clouds of its kind, stretching across 6 data centers with more than 200,000 VMs on more than 2,000 hosts.

It’s all about getting the full potential from NSX and micro-segmentation. To get the most out of NSX, we knew we needed to improve our process to identify unique traffic flows, or what you might call the micro-segmentation planning process. At VMware, that’s part of what we call the application discovery process. It was a manual process and very time consuming, so it was delaying our micro-segmentation deployment.”

Speeding up their NSX deployment time was a big goal.

Adds Hendre “Network Insight provides East-West traffic analytics support right out of the box, so it made our planning process very efficient. we now have better control and tracking of our virtual distributed firewalls. That’s a huge help when it comes to meeting audit and compliance requirements.

We also have faster, intuitive insight into problems that our general support staff can understand, so we don’t have to run-up all issues to our networking experts. We can also create point-in-time dashboards and share them among teams in alert notifications, so everyone gets a good snapshot of the issue.”

John Tompkins adds “Network Insight, like the name suggests, really opens your eyes. Now we can identify issues with our NSX deployments that we hadn’t been aware of. We have visibility into things that what would have been black holes in the past. That lets us move forward with confidence.

Check out these links:

David Davis on vRealize Operations – Post #33 – What is vRealize Network Insight (vRNI) ?

VMware on VMware: http://www.vmware.com/company/vmware-on-vmware.html

February 15th: Getting More Out of VMware with vRealize Network Insight

vRealize Network Insight New Customer E-Book

vRealize Network Insight and NSX – New Infographic


The post VMware on VMware: vRealize Network Insight appeared first on VMware Cloud Management.

Predictive DRS Made Simple

$
0
0

In 2016 VMware made big news with our Predictive DRS (pDRS) announcement and analysts and customers have been buzzing about it ever since. Predictive DRS is a game changer and helps you in the fight against resource contention.  As you know, when contention occurs, applications slow down and your users are affected.  Successfully mitigating resource contention is one of the most critical issues faced by any administrator of a virtualized environment.

The newest release of vRealize Operations 6.5 improves pDRS by allowing it to scale for ANY environment.  Previously we recommended running pDRS on clusters with under 4,000 VMs.  That “limitation” has been removed, so pDRS can now be used in your largest clusters.

I get really animated when I tell the Predictive DRS story.  I love the simplicity of it all.  How the two previous resource contention methodologies (Reactive and Balance) have their pros and cons.  How they are augmented by the new Predictive method.  How together these three methodologies provide a safety net for your workloads, ensuring they get the resources they need.

I think this new video explains it best: VMware Predictive Distributed Resource Scheduler

In a complex datacenter, all three risk mitigation methods are required to fully manage contention. VMware DRS and vRealize Operations offer you all three, in cohesive one solution.

For a more in-depth look at how DRS & pDRS function, I recommend these blog posts.

https://blogs.vmware.com/vsphere/2015/05/drs-keeps-vms-happy.html

https://blogs.vmware.com/vsphere/2016/05/load-balancing-vsphere-clusters-with-drs.html

https://blogs.vmware.com/management/2016/11/predictive-drs.html

https://blogs.vmware.com/management/2017/02/setting-record-straight-drs-pdrs-workload-placement.html

The post Predictive DRS Made Simple appeared first on VMware Cloud Management.

Viewing all 242 articles
Browse latest View live


<script src="https://jsc.adskeeper.com/r/s/rssing.com.1596347.js" async> </script>